| Overview |
Perform a Regression Analysis
To run a simple linear regression on the Fitness data, follow these steps.
- Select Statistics
 Regression
  Simple ... to select the Simple Regression task.
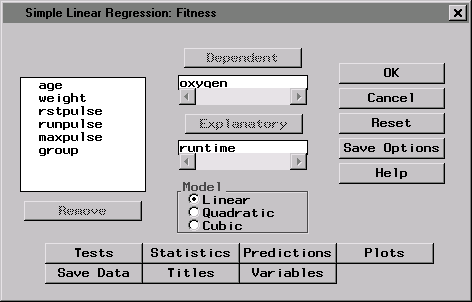
 - In the Simple Linear Regression dialog, select oxygen from the list and click on the Dependent button to designate oxygen consumption as the dependent variable. Select runtime from the list and click on the Explanatory button to designate the amount of time to run 1.5 miles as the explanatory variable.

Figure 1.3: Dependent and Explanatory Variables
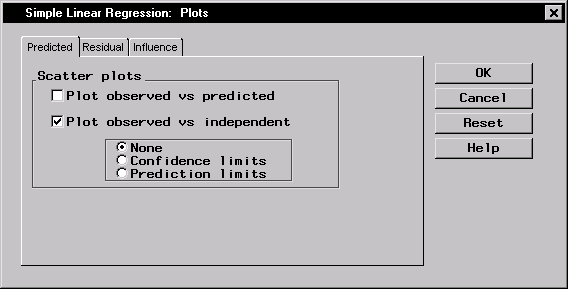
- To create a scatter plot of your results, click on the Plots button. In the Predicted tab, select Plot observed vs independent.

Figure 1.4: Scatter Plot
Click OK.
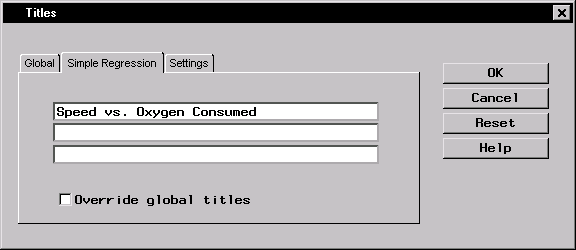
- In the Simple Linear Regression dialog, click on the Titles button to specify a title for your results. In the first field of the Titles dialog, type Speed vs. Oxygen Consumed.

Figure 1.5: Title
Click OK.
- Click OK in the Simple Linear Regression dialog to generate the results.
Copyright © 2007 by SAS Institute Inc., Cary, NC, USA. All rights reserved.