| Repeated Measures |
Introduction
Repeated measures analysis deals with response outcomes measured on the same experimental unit at different times or under different conditions. Longitudinal data are a common form of repeated measures in which measurements are recorded on individual subjects over a period of time. Blood pressure measured once a week for a month, CD4 counts tracked over a year in an AIDS clinical trial, and per capita demand deposits over years are examples of longitudinal data. Repeated measures can also refer to multiple measurements on an experimental unit, such as the thickness of vertebrae in animals.
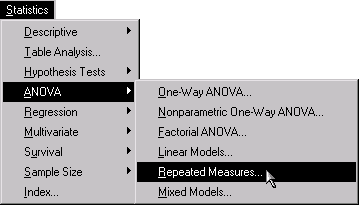 |
Figure 16.1: Repeated Measures Menu
The experimental units are often subjects. In a repeated measurements analysis, you are usually interested in between-subject and within-subject effects. Between-subject effects are those whose values change only from subject to subject and remain the same for all observations on a single subject, for example, treatment and gender. Within-subject effects are those whose values may differ from measurement to measurement, for example, time. Usually, you are also interested in some between-subject and within-subject interaction, such as treatment by time.
Since measurements on the same experimental unit are likely to be correlated, repeated measurements analysis must account for that correlation. One way of doing this is by modeling the covariance structure of an individual's response. The compound symmetry structure assumes the same covariance between any two measurements and the same variance for each measurement. However, sometimes the covariance of measures that are close together in time is higher than the covariance for measurements further apart. In this case, the first-order autoregressive covariance structure may be more appropriate. Another possible covariance structure is unstructured, in which you estimate different parameters for the variance of each repeated measurement as well as different covariance parameters for each pair of repeated measurements.
The Repeated Measures task enables you to specify a repeated measures model with interactions and nested terms, define subject and repeated effects, and select from a wide range of covariance structures. You can estimate least-squares means for classification effects and output predicted values and residuals to a data set. Plots include means plots, predicted plots, and plots of residuals versus within and between effects. The Repeated Measures task applies methods based on the mixed model with special parametric structures on the covariance matrices.
The example in this chapter demonstrates how you can use the Repeated Measures task in the Analyst Application to analyze repeated measurements data.
Copyright © 2007 by SAS Institute Inc., Cary, NC, USA. All rights reserved.