| Mixture Designs |
The Contour Optimizer
The contour optimizer accommodates the unique issues surrounding mixture designs. The triangle is a cross section of a cube through the three corners where one coordinate is one and the rest are zero. This corresponds to the two-dimensional region where the factors sum to one. In general, if there are ![]() factors, the simplex will have the dimension
factors, the simplex will have the dimension ![]() .
.
|
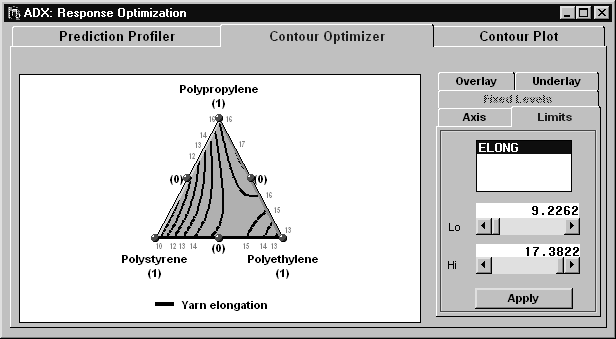
The coordinate system for a mixture design is a simplex coordinate system. The vertices correspond to pure blends, and the triangle edges correspond to binary blends. The contours of the predicted response are plotted on the face of the triangle. The symbol markers indicate design points.
You can interact with the contour optimizer, just as with other contour plots:
- Click on a contour line to label it.
- Click in the background to create an annotation.
- Right-click and select Annotate from the menu to create or delete a permanent annotation.
- Grab a contour line to move it.
|
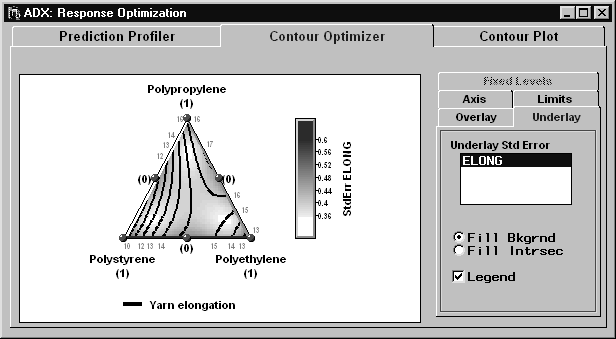
You can also underlay the standard deviation of the response under the contour lines. In this example the goal is to maximize the predicted elongation while minimizing the prediction variance.
|
To add a standard error underlay, follow these steps:
- Click the Underlay tab.
- Select ELONG. The legend indicates that the lightest areas are those with the lowest standard error.
- Maximize the Contour Plot window to make it easier to interact with the plot.
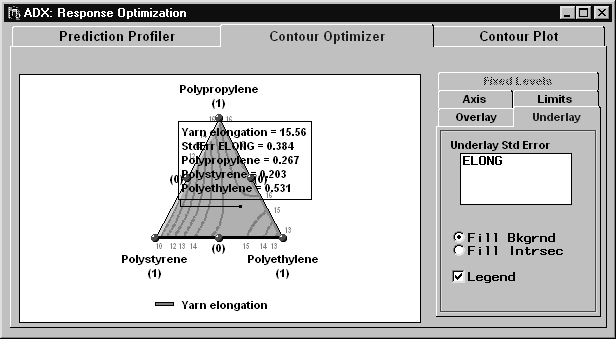
Click between the contour lines near the top of the triangle to see factor, response, and standard error values at that area of the plot. For two-factor blends, click near the midpoints of the sides of the triangle.
For a pure blend, with minimal standard error and maximum yarn elongation, you can use PROP to achieve a predicted elongation of 17. For a binary blend, you can use a mixture of ETH and STY to achieve an elongation of around 15.
Note that you can select additional options for the contour plot, including colors and fonts, by right-clicking and selecting Properties from the menu.
Copyright © 2008 by SAS Institute Inc., Cary, NC, USA. All rights reserved.