| Full Factorial Designs |
Tying It All Together
The reporting mechanism in ADX enables you to share your results on a corporate local area network or the World Wide Web. Before generating a report, do the following:
- Click Experiment Notes.
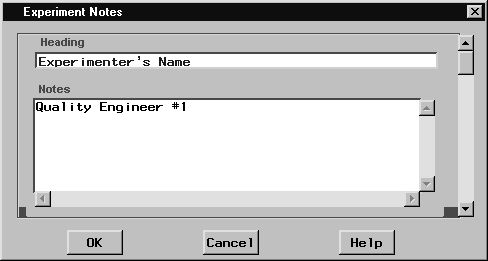
- A dialog box will appear with two fields: Heading and Notes. The heading in this case is Experimenter's Name. Type your name in the second field.
- Scroll down and enter other pertinent information about your experiment.
- Click OK to return to the main design window.
It is always a good idea to enter this information, especially if the results of this experiment will be stored in an experimental database or data warehouse.
To generate a report, do the following:
- Click Report in the main design window.
- The ADX Report window will appear. Ensure that all report items are selected (holding down the SHIFT key and clicking if necessary).
- Click the Responses tab, and hold down the SHIFT key and click to ensure that all responses are selected.
- Select HTML.
- Click Graphics Files. A window with a list at the top and an image viewer at the bottom will appear. Every plot for which you selected View
 Include in Report will appear here. Click the appropriate row to view the graphic.
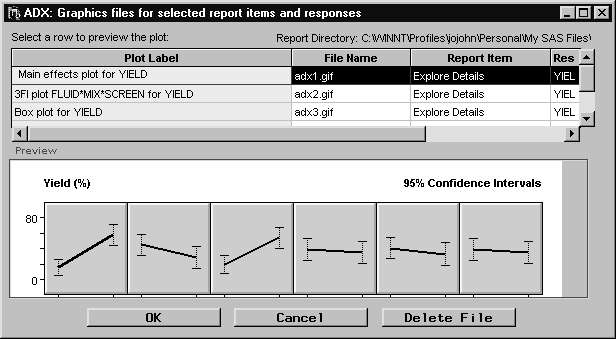
- If you decide not to include a particular graphic, select the appropriate row and click Delete File.
- Click OK to close the window and return to the ADX Report window.
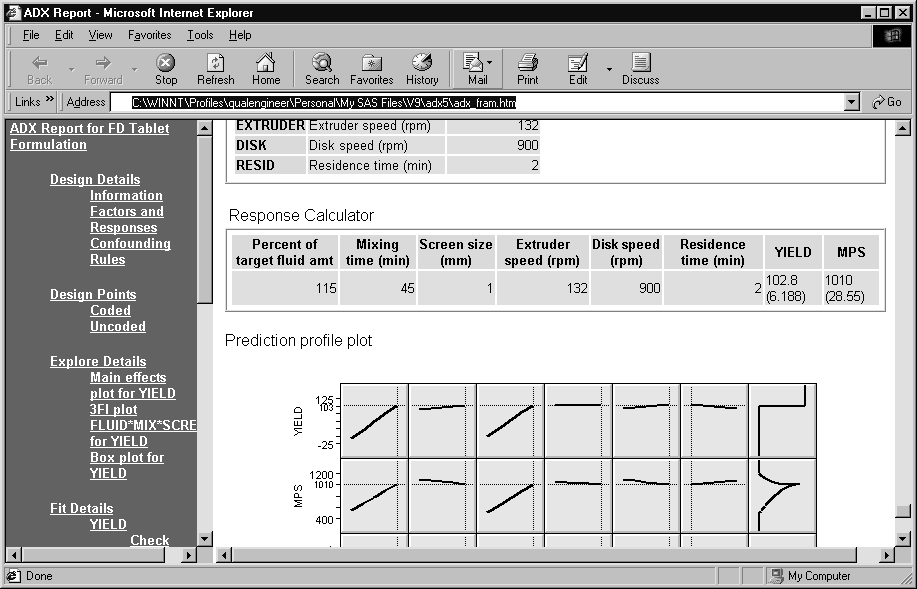
- Click Generate Report to generate an HTML report and view it in your default browser.
|
Copyright © 2008 by SAS Institute Inc., Cary, NC, USA. All rights reserved.