| Fractional Factorial Designs |
Scatter Plot
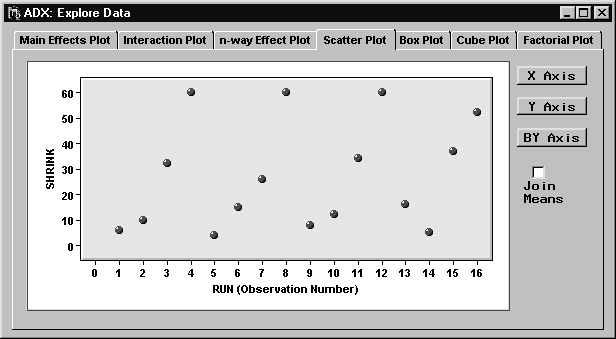
A scatter plot is often used to determine run-order effects. Click the Scatter Plot tab. The default plot displays an unusual pattern, which might be the result of a time dependence.
|
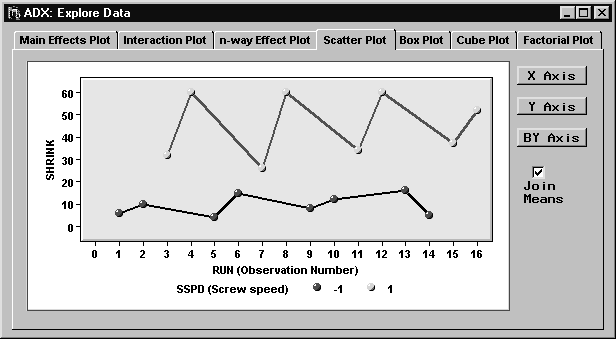
However, it is revealing to select SSPD as the BY Axis variable and select Join Means.
|
This plot suggests that SSPD is significant and that run order is not randomized.
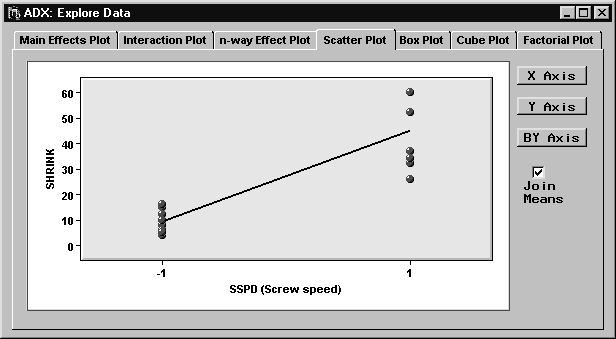
You can also use the scatter plot to create a main-effects plot in which the individual response values are displayed in addition to their averages. For example, the following plot shows the main effect of SSPD.
|
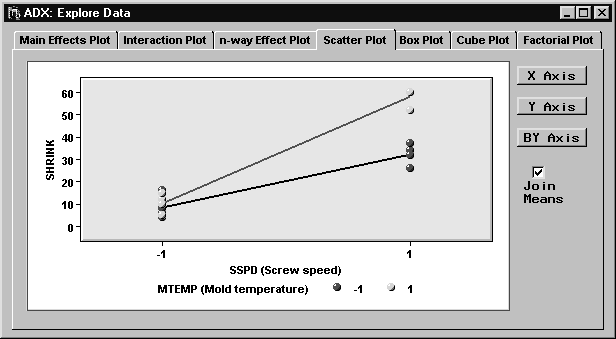
Likewise, you can use the scatter plot facility to create an interaction plot in which the individual response values are displayed. For example, the following is an interaction plot for MTEMP*SSPD, which you can create by selecting MTEMP as a BY variable by clicking the BY Axis button.
|
You can use the scatter plot to plot any variable in the design against any other variable by selecting a third BY variable (from the menu that appears when you click the BY Axis button) to classify the points on the plot. This is useful for creating custom plots for situations in which the standard plots might not apply.
Copyright © 2008 by SAS Institute Inc., Cary, NC, USA. All rights reserved.