| Fractional Factorial Designs |
Cube Plot
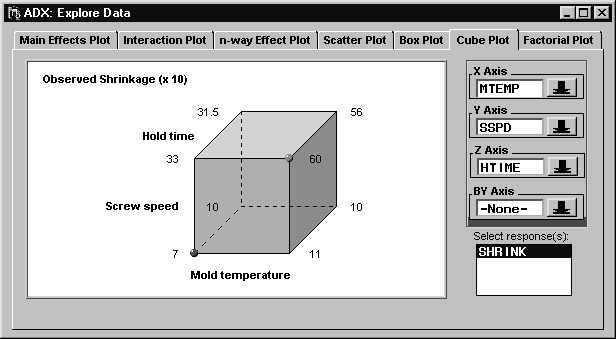
Click Explore and then the Cube Plot tab to display a cube plot. (See the section "Getting Started with a Simple Example" for another example of using cube plots.)
The response means of the factor levels are displayed on the corners of the cube. Low levels of the factors are to the left, front, or bottom, and high levels are to the right, back, or front of the cube dimension. Different colored symbols mark the high and low responses on the cube.
|
The extreme values occur when HTIME and MTEMP are both at their lowest values and when HTIME and MTEMP are both at their highest values. Since the shrinkage averages at the front of the cube are close to those in the corresponding positions at the back, you might conclude that SSPD is not active. On the other hand, the shrinkage averages in the other dimensions indicate that the HTIME and MTEMP main effects, and their interaction, are active.
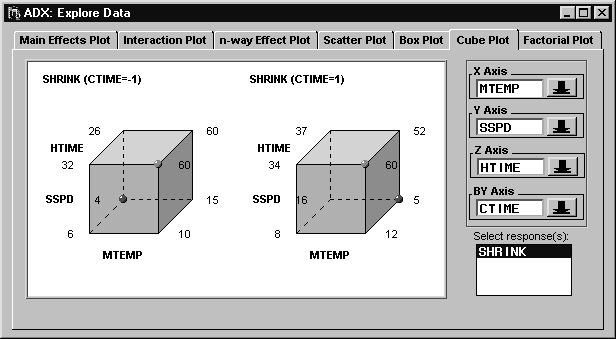
The ADX system also provides side-by-side cube plots at different levels of a fourth factor. To view cube plots side by side, select a factor not already displayed from the BY Axis list.
|
The difference in average shrinkage at the rear left bottom corners of the cubes is -12, while the difference at the rear right bottom corners is 10. This suggests a possible interaction between CTIME and MTEMP. However, this needs to be confirmed with a formal test.
Copyright © 2008 by SAS Institute Inc., Cary, NC, USA. All rights reserved.