<%// MultipleResponses:%>
<%
// To graph mutliple Response variables by the same Category variable,
// add the Response variables to an AnalysisVariableList, and then
// assign the Response role to that list rather than to an individual variable.
%>
<%@page import="com.sas.servlet.tbeans.graphics.html.WaterfallChart,
com.sas.graphics.components.waterfallchart.WaterfallChartTableDataModel,
com.sas.graphics.components.AnalysisVariable,
com.sas.graphics.components.AnalysisVariableList,
com.sas.graphics.components.ClassificationVariable,
com.sas.graphics.components.GraphConstants,
javax.swing.table.DefaultTableModel"
%>
<%
// Create a WaterfallChart and a data source
WaterfallChart waterfallChart=new WaterfallChart();
%>
<%@ include file="TransactionData.jsp" %>
<%
// Create a data model and attach the data source
WaterfallChartTableDataModel dataModel=
new WaterfallChartTableDataModel();
dataModel.setModel(dataTable);
// Define multiple Response variables
AnalysisVariableList multiResponse=new AnalysisVariableList(
new AnalysisVariable[] {
new AnalysisVariable("TransactionQ1", "nlmnlusd"),
new AnalysisVariable("TransactionQ2", "nlmnlusd")
} );
// Assign the variable roles and sort category values in descending order
dataModel.setCategoryVariable(
new ClassificationVariable("Id", GraphConstants.SORT_DESCENDING));
// Assign the Response variable role and apply the NLMNLUSD format so
// that Transaction amounts in the output are displayed in an
// internationalized representation of US dollars.
dataModel.setResponseVariable(multiResponse);
// Call the data model's setCategorySortVariable() method
// to sort bars according to the values of the response variable
dataModel.setCategorySortVariable(dataModel.getResponseVariable());
// Assign the data model to the WaterfallChart
waterfallChart.setDataModel(dataModel);
// Set a graph title
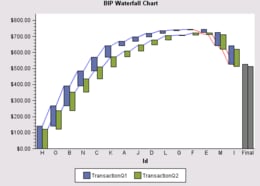
waterfallChart.getTitle1().setText("BIP Waterfall Chart");
// Set HTTP-specific response and request functionality
waterfallChart.setResponse(response);
waterfallChart.setRequest(request);
// Set a graph size and write the chart to the display
waterfallChart.setWidth(600);
waterfallChart.setHeight(450);
waterfallChart.write(out);
%>