<%// ChangeLine:%>
<%
// To change the line style of the line that separates tiles
// 1) Create a LineStyle to define the line attributes you want for the line
// 2) Call the TileChartModel's putOutlineLineStyle() method to assign the line
// style to the chart. The method's second argument enables you to specify
// which detail level is affected.
%>
<%@page import="com.sas.servlet.tbeans.graphics.html.TileChart,
com.sas.graphics.components.tilechart.TileChartModel,
com.sas.graphics.components.tilechart.TileChartTableDataModel,
com.sas.graphics.components.LineStyle,
com.sas.graphics.components.GraphConstants,
com.sas.measures.BaseLength,
com.sas.graphics.components.AnalysisVariable,
com.sas.graphics.components.ClassificationVariable,
com.sas.graphics.components.ClassificationVariableList,
java.awt.Color,
javax.swing.table.DefaultTableModel"
%>
<%
// Create a TileChart and a data source
TileChart tileChart=new TileChart();
%>
<%@ include file="SalesData.jsp" %>
<%
// 1) Create two new LineStyle definitions
LineStyle levelOne=new LineStyle(
Color.black,
new BaseLength(4, "px"),
GraphConstants.TRUE);
LineStyle levelTwo=new LineStyle(
Color.black,
new BaseLength(2, "px"),
GraphConstants.TRUE);
// 2) Set the line styles on the chart
TileChartModel graphModel=tileChart.getGraphModel();
graphModel.putOutlineLineStyle(levelOne, 1);
graphModel.putOutlineLineStyle(levelTwo, 2);
// Create a data model and attach the data source
TileChartTableDataModel dataModel=
new TileChartTableDataModel();
dataModel.setModel(dataTable);
// Define multiple Classification variables
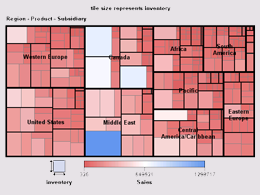
ClassificationVariableList multiTile=new ClassificationVariableList(
new ClassificationVariable[] {
new ClassificationVariable("Region"),
new ClassificationVariable("Product"),
new ClassificationVariable("Subsidiary")
} );
// Assign the classification list to the Tile variable role
dataModel.setTileVariable(multiTile);
// Assign the Size variable role
dataModel.setSizeVariable(
new AnalysisVariable("Inventory"));
// Assign the Color variable role
dataModel.setColorVariable(
new AnalysisVariable("Sales"));
// Assign the data model to the TileChart
tileChart.setDataModel(dataModel);
// Set a graph title
tileChart.getTitle1().setText("tile size represents Inventory");
// Set HTTP-specific response and request functionality
tileChart.setResponse(response);
tileChart.setRequest(request);
// Set a graph size and write the chart to the display
tileChart.setWidth(600);
tileChart.setHeight(450);
tileChart.write(out);
%>