<%// FillAreas:%>
<%
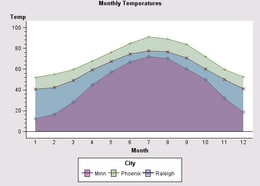
// When the specification on the data model generates multiple plot lines,
// the areas between the lines can be filled by calling the
// LineChartModel's setFillAreaEnabled() method with the argument value
// true. Optionally, you can define a fill for the areas and set the
// fill on the DataElementStyles. This sample uses the SubgroupVariable
// role to generate multiple plot lines.
%>
<%@page import="com.sas.models.SimpleTable,
com.sas.swing.models.TableModelAdapter,
com.sas.servlet.tbeans.graphics.html.LineChart,
com.sas.graphics.components.linechart.LineChartTableDataModel,
com.sas.graphics.components.AnalysisVariable,
com.sas.graphics.components.ClassificationVariable,
com.sas.graphics.components.linechart.LineChartModel,
com.sas.graphics.components.DataElementStyles,
com.sas.graphics.components.FillStyle,
java.awt.Color"
%>
<%
// Create a LineChart instance
LineChart lineChart = new LineChart();
// Create a simple SAS table and add data to it
SimpleTable table = new SimpleTable();
%>
<%@ include file="SubGroupSampleData.jsp" %>
<%
// Convert a simple SAS table to a simple Java Swing table
TableModelAdapter tma = new TableModelAdapter(table);
tma.setFormattedDataUsed(false);
// Create a data model and attach the data source to it
LineChartTableDataModel lineChartDataModel=
new LineChartTableDataModel(tma);
// Get the plot's graph model and enable filled areas
LineChartModel graphModel=lineChart.getGraphModel();
graphModel.setFillAreaEnabled(true);
// Create transparent fills for the filled areas
FillStyle[] transparencies=new FillStyle[] {
new FillStyle(new Color(204,0,102,100) ), // red transparency
new FillStyle(new Color(102,153,102,100) ), // green transparency
new FillStyle(new Color(51,102,255,100) ) }; // blue transparency
// Set the fills on the plot areas
graphModel.getDataElementStyles().setFillStyles(transparencies);
// Assign the SubgroupVariable role so there are multiple plots
lineChartDataModel.setSubgroupVariable(
new ClassificationVariable("City"));
// Assign the Category and Response variable roles
lineChartDataModel.setCategoryVariable(
new ClassificationVariable("Month"));
lineChartDataModel.setResponseVariable(
new AnalysisVariable("Temp"));
lineChartDataModel.setSubgroupVariable(
new ClassificationVariable("City"));
// Assign the data model to the BarChart
lineChart.setDataModel(lineChartDataModel);
// Set a title
lineChart.getTitle1().setText("Raleigh Monthly Temperatures");
// Set HTTP-specific response and request functionality
lineChart.setResponse(response);
lineChart.setRequest(request);
// Write the chart to the display
lineChart.write(out);
%>