<%// ChangeMarker:%>
<%
// A graph's display properties (marker symbol, axis characteristics, and
// so on) are general properties that are defined in the graph's model. The
// marker characteristics are defined as MarkerStyles that are applied to
// the plot's DataElementStyles. Thus, the change the markers,
// 1) Get the LineChart's model
// 2) Disable interpolation and enable plot markers
// 3) Define a MarkerStyle for the plot markers
// 4) Set the MarkerStyle on the model's DataElementStyles
%>
<%@page import="com.sas.models.SimpleTable,
com.sas.swing.models.TableModelAdapter,
com.sas.servlet.tbeans.graphics.html.LineChart,
com.sas.graphics.components.linechart.LineChartModel,
com.sas.graphics.components.MarkerStyle,
com.sas.graphics.util.Markers,
com.sas.graphics.components.linechart.LineChartTableDataModel,
com.sas.graphics.components.AnalysisVariable,
com.sas.graphics.components.ClassificationVariable"
%>
<%
// Create a LineChart instance
LineChart lineChart = new LineChart();
// Create a simple SAS table and add data to it
SimpleTable table = new SimpleTable();
%>
<%@ include file="SampleData.jsp" %>
<%
// Convert a simple SAS table to a simple Java Swing table
TableModelAdapter tma = new TableModelAdapter(table);
tma.setFormattedDataUsed(false);
// 1) Get the LineChart's model
LineChartModel gModel=lineChart.getGraphModel();
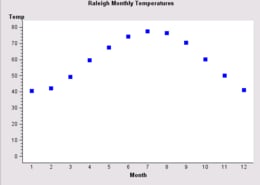
// 2) Disable interpolation and enable plot markers
gModel.setInterpolationEnabled(false);
gModel.setMarkerEnabled(true);
// 3) Define a MarkerStyle for the plot markers
MarkerStyle[] markerStyle=new MarkerStyle[] {
new MarkerStyle(Markers.SQUARE_FILLED)};
// 4) Set the MarkerStyle on the model's DataElementStyles
gModel.getDataElementStyles().setMarkerStyles(markerStyle);
// Create a data model and attach the data source to it
LineChartTableDataModel lineChartDataModel=
new LineChartTableDataModel(tma);
// Assign the Category and Response variable roles
lineChartDataModel.setCategoryVariable(
new ClassificationVariable("Month"));
lineChartDataModel.setResponseVariable(
new AnalysisVariable("Temp"));
// Assign the data model to the BarChart
lineChart.setDataModel(lineChartDataModel);
// Set a title
lineChart.getTitle1().setText("Raleigh Monthly Temperatures");
// Set HTTP-specific response and request functionality
lineChart.setResponse(response);
lineChart.setRequest(request);
// Write the chart to the display
lineChart.write(out);
%>