<%// ChangeInterpolation:%>
<%
// To change a LineChart's interpolation method
// 1) Get the plot's graph model
// 2) Use the model to get the DataElementStyles
// 3) Use the DataElementStyles to get the array of MarkerStyles
// 4) Use a MarkerStyle element to specify the interpolation method
%>
<%@page import="com.sas.models.SimpleTable,
com.sas.swing.models.TableModelAdapter,
com.sas.servlet.tbeans.graphics.html.LineChart,
com.sas.graphics.components.linechart.LineChartModel,
com.sas.graphics.components.linechart.LineChartTableDataModel,
com.sas.graphics.components.AnalysisVariable,
com.sas.graphics.components.ClassificationVariable,
com.sas.graphics.components.DataElementStyles,
com.sas.graphics.components.MarkerStyle"
%>
<%
// Create a LineChart instance
LineChart lineChart = new LineChart();
// Create a simple SAS table and add data to it
SimpleTable table = new SimpleTable();
%>
<%@ include file="SampleData.jsp" %>
<%
// 1) Get the plot's graph model
LineChartModel graphModel=lineChart.getGraphModel();
// 2) Use the model to get the DataElementStyles
DataElementStyles des = graphModel.getDataElementStyles() ;
// 3) Use the DataElementStyles to get the array of MarkerStyles
MarkerStyle[] markerStyles = des.getMarkerStyles();
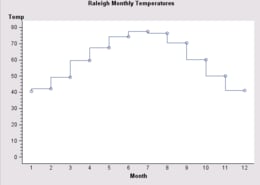
// 4) Use a MarkerStyle element to specify the interpolation method
markerStyles[0].setInterpolation(MarkerStyle.INTERPOLATION_STEP_RIGHT);
markerStyles[0].setVisible(true);
// Convert a simple SAS table to a simple Java Swing table
TableModelAdapter tma = new TableModelAdapter(table);
tma.setFormattedDataUsed(false);
// Create a data model and attach the data source to it
LineChartTableDataModel lineChartDataModel=
new LineChartTableDataModel(tma);
// Assign the Category and Response variable roles
lineChartDataModel.setCategoryVariable(
new ClassificationVariable("Month"));
lineChartDataModel.setResponseVariable(
new AnalysisVariable("Temp"));
// Assign the data model to the BarChart
lineChart.setDataModel(lineChartDataModel);
// Set a title
lineChart.getTitle1().setText("Raleigh Monthly Temperatures");
// Set HTTP-specific response and request functionality
lineChart.setResponse(response);
lineChart.setRequest(request);
// Write the chart to the display
lineChart.write(out);
%>