<%// ChangeBarWidth:%>
<%
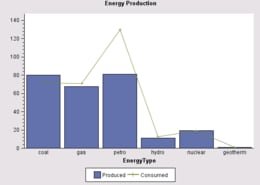
// A graph's display properties (bar width, orientation, axis characteristics,
// and so on) are general properties that are defined in the graph's model.
// Thus, to change the width of bar elements,
// 1) Get the BarLineChart's graph model
// 2) Call setGrowBarWidthEnabled() to set the boolean to true
// 3) Call setBarWidth() to set a width for the bars
%>
<%@page import="com.sas.models.SimpleTable,
com.sas.swing.models.TableModelAdapter,
com.sas.servlet.tbeans.graphics.html.BarLineChart,
com.sas.graphics.components.barlinechart.BarLineChartModel,
com.sas.graphics.components.barlinechart.BarLineChartTableDataModel,
com.sas.graphics.components.AnalysisVariable,
com.sas.graphics.components.ClassificationVariable,
com.sas.measures.BaseLength"
%>
<%
// Create a BarLineChart instance
BarLineChart barLineChart = new BarLineChart();
// Create a simple SAS table and add data to it
SimpleTable table = new SimpleTable();
%>
<%@ include file="EnergyData.jsp" %>
<%
// Convert a simple SAS table to a simple Java Swing table
TableModelAdapter tma= new TableModelAdapter(table);
tma.setFormattedDataUsed(false);
// 1) Get the BarLineChart's graph model
BarLineChartModel graphModel=barLineChart.getGraphModel();
// 2) Call setGrowBarWidthEnabled() to set the boolean to true
graphModel.setGrowBarWidthEnabled(true);
// 3) Call setBarWidth() to set a width for the bars
graphModel.setBarWidth(new BaseLength("0.75in"));
// Create a data model and attach the data source
BarLineChartTableDataModel dataModel=
new BarLineChartTableDataModel(tma);
// Assign the Category variable role, and the
// BarResponse and LineResponse variable roles
dataModel.setCategoryVariable(
new ClassificationVariable("EnergyType"));
dataModel.setBarResponseVariable(
new AnalysisVariable("Produced"));
dataModel.setLineResponseVariable(
new AnalysisVariable("Consumed"));
// Assign the data model to the BarLineChart
barLineChart.setDataModel(dataModel);
// Set a graph title
barLineChart.getTitle1().setText("Energy Production");
// Set HTTP-specific response and request functionality
barLineChart.setResponse(response);
barLineChart.setRequest(request);
// Write the chart to the display
barLineChart.write(out);
%>