// MultipleResponses:
// To graph mutliple Response variables by the same Category variable,
// add the Response variables to an AnalysisVariableList, and then
// assign the Response role to that list rather than to an individual variable.
import com.sas.graphics.components.GraphStyle;
import com.sas.graphics.components.waterfallchart.WaterfallChart;
import com.sas.graphics.components.waterfallchart.WaterfallChartTableDataModel;
import com.sas.graphics.components.AnalysisVariableList;
import com.sas.graphics.components.AnalysisVariable;
import com.sas.graphics.components.ClassificationVariable;
import com.sas.graphics.components.GraphConstants;
import javax.swing.table.DefaultTableModel;
import java.awt.BorderLayout;
import java.awt.Color;
import java.awt.Container;
import java.awt.event.WindowAdapter;
import java.awt.event.WindowEvent;
import javax.swing.JFrame;
import javax.swing.JPanel;
public class MultipleResponses extends JPanel {
private MultipleResponses theApp;
public MultipleResponses () {
setLayout(new BorderLayout());
// Create a WaterfallChart and a data source
WaterfallChart waterfallChart=new WaterfallChart();
SampleData dataTable=new SampleData();
// Create a data model and attach the data source
WaterfallChartTableDataModel dataModel=
new WaterfallChartTableDataModel();
dataModel.setModel(dataTable);
// Define multiple Response variables
AnalysisVariableList multiResponse=new AnalysisVariableList(
new AnalysisVariable[] {
new AnalysisVariable("TransactionQ1", "nlmnlusd"),
new AnalysisVariable("TransactionQ2", "nlmnlusd")
} );
// Assign the variable roles and sort category values in descending order
dataModel.setCategoryVariable(
new ClassificationVariable("Id", GraphConstants.SORT_DESCENDING));
// Assign the Response variable role and apply the NLMNLUSD format so
// that Transaction amounts in the output are displayed in an
// internationalized representation of US dollars.
dataModel.setResponseVariable(multiResponse);
// Call the data model's setCategorySortVariable() method
// to sort bars according to the values of the response variable
dataModel.setCategorySortVariable(dataModel.getResponseVariable());
// Assign the data model to the WaterfallChart
waterfallChart.setDataModel(dataModel);
// Set a graph title
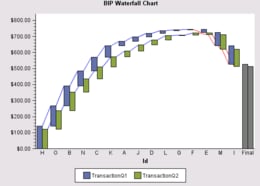
waterfallChart.getTitle1().setText("BIP Waterfall Chart");
add(waterfallChart, BorderLayout.CENTER);
}
// Create the data source
static private class SampleData extends DefaultTableModel {
private static Class columnClass[]={Double.class, Double.class, String.class};
private static String columnNames[]={ "TransactionQ1", "TransactionQ2", "Id" };
public SampleData() {
super();
Object data[][] = {
{new Double( 23),new Double( 33),"D"}
, {new Double( 85),new Double( 75),"C"}
, {new Double( 27),new Double( 37),"A"}
, {new Double( -20),new Double( -10),"E"}
, {new Double( 125),new Double( 115),"B"}
, {new Double( 3),new Double( 13),"F"}
, {new Double( 6),new Double( 3),"G"}
, {new Double( 142),new Double( 122),"H"}
, {new Double(-117),new Double(-107),"I"}
, {new Double( 26),new Double( 36),"J"}
, {new Double( 73),new Double( 63),"K"}
, {new Double( 16),new Double( 26),"L"}
, {new Double( -82),new Double( -92),"M"}
, {new Double( 93),new Double( 83),"N"}
, {new Double( 126),new Double( 116),"O"}
};
setDataVector(data, columnNames);
}
public Class getColumnClass(int column) {
return columnClass[column];
}
}
public static void main(String[] args) {
JFrame frame = new JFrame("BIP Graph Sample");
Container container = frame.getContentPane();
container.setLayout(new BorderLayout());
container.setBackground(Color.white);
JPanel bipPanel = new JPanel();
bipPanel.setLayout(new BorderLayout());
MultipleResponses bipGraphSample = new MultipleResponses ();
bipPanel.add(bipGraphSample, BorderLayout.CENTER);
container.add(bipPanel, BorderLayout.CENTER);
frame.setSize(600,450);
frame.addWindowListener(new WindowAdapter() {
public void windowClosing(WindowEvent e) {
System.exit(0);
}
} );
frame.setVisible(true);
}
}