The minimum specification for a ScatterPlot requires a valid data model. Generally the data model should assign the X and Y variable roles to PlotVariables in the data. If the X role is not assigned, the ScatterPlot automatically assigns it to the first numeric column found in the data model, or to the first string column if the model has no numeric column. If the Y role is not assigned, the ScatterPlot selects the first numeric column that is different from X and uses it as the Y variable. If no valid numeric column is found, then it selects the first string column that is different from X and uses it in the Y role.
If multiple variables are assigned the X role or the Y role, a separate plot line is generated for each variable. If X and Y both have multiple variables, then a line is produced for each pair of X and Y values. For example, if X has values x1, x2, x3 and Y has values y1, y2, y3, then there will be three lines: one line for (x1, y1), another for (x2, y2), and a third for (x3, y3). With multiple variables assigned X and/or Y roles, all plot lines use the same set of axes. If a group variable is specified, a different color and marker shape is used for each plot generated by the plot values.
If ColumnVariable and/or RowVariable roles are specified, a separate plot is produced for each classification value, and each plot has its own axes. The plots are arranged in a column for the ColumnVariable role, in a row for the RowVariable role, or in a graph matrix if both columns and rows are used. In the graph matrix, a separate graph is produced for each (column, row) value pair. You can control the arrangement and text of the labels and values that identify the column and row axes.
If High and/or Low arguments are specified on a PlotVariable's constructor, up and down errors are generated if the variable is assigned the Y role; left and right errors are generated if the variable is assigned the X role. In either case, the error values must be numeric. In the plot, errors are joined to their respective markers. You can define styles for the error marker and error line.
A scatter plot's data properties are defined in a data model that descends from ScatterPlotDataModel, an abstract class whose subclasses provide a handle to the data and determine the number and arrangement of data elements (plot points). ScatterPlotDataModel has the following subclasses:
A ScatterPlot's individual display properties can be set by calling the ScatterPlot's getGraphModel() method, which returns a ScatterPlotModel that can be used to set the desired properties. The ScatterPlotModel class contains
Although modifying the ScatterPlotModel provides considerable control, it can be tedious to modify properties individually. For example, graphs distinguish between different types of text, such as label text, value text, data-label text, and title text. The text might also apply to different locations, such as the response axis, response2 axis, category axis, and legend. Whereas the ScatterPlotModel can independently control these different text types and locations, doing so requires you to apply the same properties to all applicable locations.
An easier way to set a ScatterPlot's display properties is to apply a pre-defined GraphStyle to the plot. A graph style sets many of the graph's visual characteristics, such as its use of colors, fonts, background, transparency, drop shadows, and more. A graph style can be used as is or modified through the GraphStyle class.
A graph style can be specified as an argument on a ScatterPlot's constructor. Or, it can be applied to an existing plot by calling the ScatterPlot's applyGraphStyle() method as follows:
ScatterPlot scatterPlot = new ScatterPlot();
scatterPlot.applyGraphStyle(new GraphStyle(GraphStyle.STYLE_SCIENCE);
Applying a GraphStyle to a graph propagates the GraphStyle's properties onto all applicable graph properties, including those in the graph model.
Rather than use the style as is, you can modify it before applying it. Modifying the style definition is typically easier and more convenient than modifying the graph's individual display properties. For example, the GraphStyle class contains only a single set of value text propertes. After applying the modified style, you can still adjust individual properties through the graph model.
The following code fragment modifies a graph style before applying it to a graph, and then uses the graph model to adjust an individual property.
// Create and modify a graph style
GraphStyle graphStyle = new GraphStyle(GraphStyle.STYLE_SCIENCE);
   graphStyle.getValueTextStyle().setColor(Color.darkGray);
   graphStyle.getValueTextStyle().setFont(new java.awt.Font("Arial",Font.BOLD,14));

// Apply the modified graph style to a plot
ScatterPlot scatterPlot = new ScatterPlot();
   scatterPlot.applyGraphStyle(graphStyle);

// Set the category axis value text to black
ScatterPlotModel graphModel=scatterPlot.getGraphModel();
   graphModel.getCategoryAxisModel().getValueTextStyle().setColor(Color.black);
Whether you set a graph style or individual display properties, the new display settings override any previous settings that were applied to the graph. For example, if a gray background has been set on a graph, and then a style is applied to that same graph, the style's background replaces the previously set gray background.
The ScatterPlot component supports four titles and two footnotes, each with its own display attributes. To display multiple lines of text with the same attributes, use the line-end character (\n) in the specified text string.
To assign a title or footnote,
The easiest way to set the text for a title or footnote is to get the plot's title or footnote property and set its text as follows:
scatterPlot.getTitle1().setText("Line One\nLine Two");
To change the text attributes for a title or footnote, set the attributes on a NoteModel and assign the NoteModel to the appropriate title or footnote. The following example sets the title "Product Revenue" and displays it in blue, using a 24-point TimesRoman font with a drop shadow.
NoteModel myTitle = new NoteModel( "Product Revenue" );
myTitle.getTextStyle().setColor(Color.blue);
myTitle.getTextStyle().setFont(new java.awt.Font("TimesRoman",Font.PLAIN,24));
myTitle.getTextStyle().getShadowStyle().setVisible(true);

// Create the graph and assign the title
ScatterPlot scatterPlot = new ScatterPlot();
scatterPlot.setTitle1( myTitle );
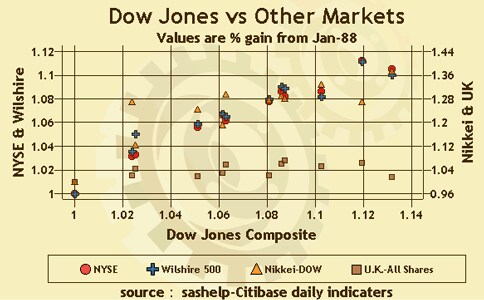
The following example compares various stock markets with the Dow Jones Industrial Average. Data used are from January 1988 to December 1990. In the example, the TableModel that is graphed contains numeric data columns for DowJones, NYSE and Wilshire 500. To enhance the graph appearance, the Gears GraphStyle is applied to the plot.
javax.swing.table.TableModel myStockData = <...>;

// Create the ScatterPlot's data model.
ScatterPlotTableDataModel scatterPlotDataModel = new ScatterPlotTableDataModel( myStockData );
scatterPlotDataModel.setXVariable( new PlotVariable("DowJones") );
scatterPlotDataModel.setYVariable( new PlotVariable("NYSE") );
scatterPlotDataModel.setY2Variable( new PlotVariable("Wilshire 500") );

// Create the ScatterPlot applying the data model and the "Gears" GraphStyle
scatterPlot.getTitle1().setText("Dow Jones vs Other Markets") );
scatterPlot.getTitle2().setText("Values are % gain from Jan-88") );
scatterPlot.getFootnote1().setText("source: sashelp:Citibase daily indicaters") );
ScatterPlot scatterPlot = new ScatterPlot( scatterPlotDataModel, new GraphStyle(GraphStyle.STYLE_GEARS) );
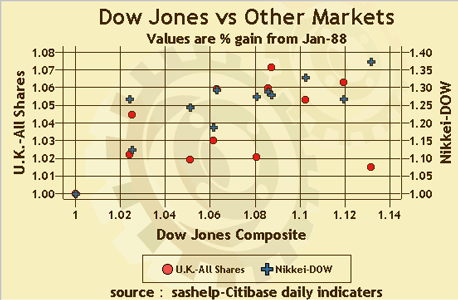
Now consider that the TableModel also contains columns for U.K.-All Shares and Nikkei-DOW. The example organizes the graph by Dow Jones Composite and other market indices.
javax.swing.table.TableModel myStockData = <...>;

// Create the LinePlot's data model.
ScatterPlotTableDataModel linePlotDataModel = new ScatterPlotTableDataModel( myStockData );
scatterPlotDataModel.setXVariable( new PlotVariable("DowJones") );
scatterPlotDataModel.setYVariable( new PlotVariableList(new PlotVarible[] {
                                 PlotVariable("NYSE")
                                ,PlotVariable("Wilshire 500")
                                });
scatterPlotDataModel.setY2Variable( new PlotVariableList(new PlotVarible[] {
                                 PlotVariable("U.K.-All Shares")
                                ,PlotVariable("Nikkei-DOW")
                                });

scatterPlot.getTitle1().setText("Dow Jones vs Other Market Indices");
scatterPlot.getTitle2().setText("Values are % gain from Jan-88");
scatterPlot.getFootnote1().setText("source: sashelp:Citibase daily indicaters");

//Set the axis labels
ScatterPlotModel linePlotModel = scatterPlot.getGraphModel();
scatterPlotModel.getYAxisModel().setLabel("NYSE & Wilshire");
scatterPlotModel.getY2AxisModel().setLabel("UK & Nikkei");
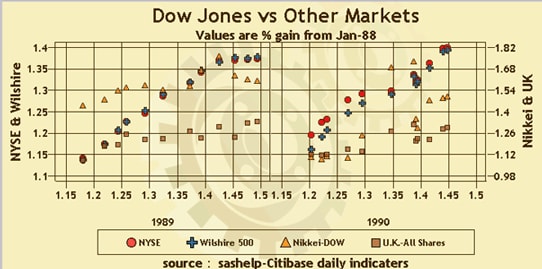
For the next example, the TableModel also contains a string data column for Year. To organize the graph by year, you could add following line to previous example:
javax.swing.table.TableModel myStockData = <...>;

// Add a row role to the data model.
scatterPlotDataModel.setRowVariable( new ClassificationVariable("Year") );
The following example uses a dataset with errorColumns:
// Create the ScatterPlot's data model.
 ScatterPlotTableDataModel scatterPlotDataModel = new ScatterPlotTableDataModel( myData );
 scatterPlotDataModel.setGroupVariable(new ClassificationVariable("S1", null , null, "S1Lab", GraphConstants.SORT_ASCENDING));

 // Create x and y variables with low and high errors
 PlotVariable pvx = new PlotVariable( "X" // ColumnName
                                                       , "$000.00" // format
                                                       , null // informat
                                                       , "Xlabel" // label
                                                       , "X1" // highColumnName
                                                       , "LeftError" // highLabel
                                                       , "X2" // lowColumnName
                                                       , "RightError" // lowLabel
                                                       );

 PlotVariable pvy = new PlotVariable( "Y" // ColumnName
                                                       , "%0.00" // format
                                                       , null // informat
                                                       , "Ylabel" // label
                                                       , "Y1" // highColumnName
                                                       , "UpError" // highLabel
                                                       , "Y2" // lowColumnName
                                                       , "DownError" // lowLabel
                                                       );

 // Attach variables to the dataModel
 scatterPlotDataModel.setXVariable(pvx);
 scatterPlotDataModel.setYVariable(pvy);
 // Create the ScatterPlot applying the data model and the "Statistical" GraphStyle
 ScatterPlot scatterPlot = new ScatterPlot( scatterPlotDataModel, new GraphStyle(GraphStyle.STYLE_STATISTICAL) );
 scatterPlot.getTitle1().setText("Plot showing high and low confidence values") );
The ScatterPlot asynchronously updates when a PropertyChangeEvent is received from any of its models (DataModel, GraphModel or NoteModels).