// ChangeAxis:
// A graph's display properties (axis characteristics, orientation, and
// so on) are general properties that are defined in the graph's model.
// Thus, to change a LinePlot's axis characteristics,
// 1) Create an AxisModel and any other objects needed to define
// axis characteristics (line style, tick intervals, ...)
// 2) Use the LinePlot to set the axis definitions on the chart
// This example creates a StrokeLineStyle to define a
// 3pt solid red line for both the X and Y axes. It
// creates an AxisModel to define a line style and tick
// characteristics for the Y axis.
import com.sas.graphics.components.lineplot.LinePlot;
import com.sas.graphics.components.AxisModel;
import com.sas.graphics.components.lineplot.LinePlotTableDataModel;
import com.sas.graphics.components.PlotVariable;
import com.sas.graphics.components.lineplot.LinePlotModel;
import com.sas.graphics.components.GraphConstants;
import com.sas.graphics.components.StrokeLineStyle;
import com.sas.measures.BaseLength;
import java.awt.BorderLayout;
import java.awt.Color;
import java.awt.Container;
import java.awt.event.WindowAdapter;
import java.awt.event.WindowEvent;
import javax.swing.JFrame;
import javax.swing.JPanel;
import javax.swing.table.DefaultTableModel;
public class ChangeAxis extends JPanel {
private ChangeAxis theApp;
public ChangeAxis () {
setLayout(new BorderLayout());
// Create a LinePlot and a data source
LinePlot linePlot=new LinePlot();
SampleData dataTable=new SampleData();
// 1) Create the objects needed to define axis characteristics.
// A StrokeLineStyle is needed to define line characteristics
// for both axes
StrokeLineStyle lineStyle=new StrokeLineStyle(
StrokeLineStyle.SASGRAPH_LINE01,
Color.red,
new BaseLength(3, "pt"),
GraphConstants.TRUE);
// An AxisModel is needed to set an define a line style and tick
// characteristics for the Y axis
AxisModel rAxis = new AxisModel();
rAxis.setAxisLineStyle(lineStyle);
rAxis.setContinuousMajorTickPositionPolicy(
GraphConstants.TICK_POSITION_INTERVAL);
rAxis.setContinuousMajorTickInterval(10);
rAxis.getMinorTickStyle().getLineStyle()
.setVisibilityPolicy(GraphConstants.FALSE);
// 2) Use the LinePlot to set the axis definitions on the chart
// Set the line color on the X axis
linePlot.getGraphModel().getXAxisModel()
.setAxisLineStyle(lineStyle);
// Set the AxisModel on the Y axis
linePlot.getGraphModel().setYAxisModel(rAxis);
// Create a data model and attach the data source
LinePlotTableDataModel dataModel=
new LinePlotTableDataModel();
dataModel.setModel(dataTable);
// Assign the X and Y variable roles
dataModel.setXVariable(
new PlotVariable("x2"));
dataModel.setYVariable(
new PlotVariable("y2"));
// Assign the data model to the LinePlot
linePlot.setDataModel(dataModel);
// Set a graph title
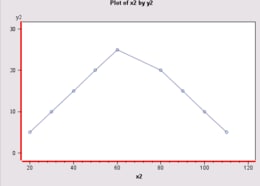
linePlot.getTitle1().setText(
"Plot of x2 by y2");
add(linePlot, BorderLayout.CENTER);
}
// Create the data source
static private class SampleData extends DefaultTableModel {
private static Class columnClass[]={ Double.class
, Double.class
, Double.class
, Double.class
, Double.class
, Double.class
};
private static String columnNames[]={ "x1"
, "x2"
, "x3"
, "y1"
, "y2"
, "y3"
};
public SampleData()
{
super();
Object data[][]={
{new Double( 10),new Double( 20), new Double( 30), new Double( 3),new Double( 5), new Double( 25)}
, {new Double( 20),new Double( 30), new Double( 40), new Double( 6),new Double( 10), new Double( 30)}
, {new Double( 30),new Double( 40), new Double( 50), new Double( 9),new Double( 15), new Double( 35)}
, {new Double( 40),new Double( 50), new Double( 60), new Double( 12),new Double( 20), new Double( 40)}
, {new Double( 50),new Double( 60), new Double( 70), new Double( 15),new Double( 25), new Double( 50)}
, {new Double( 70),new Double( 80), new Double( 90), new Double( 18),new Double( 20), new Double( 55)}
, {new Double( 80),new Double( 90), new Double( 100), new Double( 21),new Double( 15), new Double( 60)}
, {new Double( 90),new Double( 100), new Double( 110), new Double( 24),new Double( 10), new Double( 65)}
, {new Double( 100),new Double( 110), new Double( 120), new Double( 27),new Double( 5), new Double( 70)}
};
setDataVector(data, columnNames);
}
public Class getColumnClass(int column)
{
return columnClass[column];
}
}
public static void main(String[] args) {
JFrame frame = new JFrame("BIP Graph Sample");
Container container = frame.getContentPane();
container.setLayout(new BorderLayout());
container.setBackground(Color.white);
JPanel bipPanel = new JPanel();
bipPanel.setLayout(new BorderLayout());
ChangeAxis bipGraphSample = new ChangeAxis ();
bipPanel.add(bipGraphSample, BorderLayout.CENTER);
container.add(bipPanel, BorderLayout.CENTER);
frame.setSize(600,450);
frame.addWindowListener(new WindowAdapter() {
public void windowClosing(WindowEvent e) {
System.exit(0);
}
} );
frame.setVisible(true);
}
}