// SpecifyColumns:
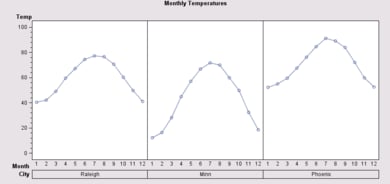
// To generate a LineChart for each value of a categorical variable
// and align the plots horizontally, assign the Column variable role
// to an appropriate categorical variable. To improve the plot
// appearance, you may need to modify tick display on the X axis.

   import com.sas.graphics.components.linechart.LineChart;
   import com.sas.graphics.components.linechart.LineChartModel;
   import com.sas.graphics.components.linechart.LineChartTableDataModel;
   import com.sas.graphics.components.AnalysisVariable;
   import com.sas.graphics.components.ClassificationVariable;
   import com.sas.graphics.components.AxisModel;
   import java.awt.BorderLayout;
   import java.awt.Color;
   import java.awt.Container;
   import java.awt.event.WindowAdapter;
   import java.awt.event.WindowEvent;
   import javax.swing.JFrame;
   import javax.swing.JPanel;
   import javax.swing.table.DefaultTableModel;

   public class SpecifyColumns extends JPanel  {
     private SpecifyColumns  theApp;
     public SpecifyColumns () {
        setLayout(new BorderLayout());

     // Create a LineChart and a data source
        LineChart lineChart=new LineChart();
        SampleData dataTable=new SampleData();

     // Create a data model and attach the data source
        LineChartTableDataModel dataModel=
                  new LineChartTableDataModel();
        dataModel.setModel(dataTable);

     // Assign the Response, Category, and Column variable roles
        dataModel.setCategoryVariable(
                  new ClassificationVariable("Month"));
        dataModel.setResponseVariable(
                  new AnalysisVariable("Temp"));
        dataModel.setColumnVariable(
                  new ClassificationVariable("City"));

     // Assign the data model to the LineChart
        lineChart.setDataModel(dataModel);

     // Set a graph title
        lineChart.getTitle1().setText(
                 "Monthly Temperatures");

        add(lineChart, BorderLayout.CENTER);
      }
  // Create the data source
     static private class SampleData extends DefaultTableModel {
       private static Class  columnClass[]={
                   Double.class, Double.class, String.class};
       private static String columnNames[]={
                  "Month","Temp","City"};
         public SampleData() {
	   super();
           Object data[][] = {
             {new Double(1),  new Double(40.5),   "Raleigh" },
             {new Double(1),  new Double(12.2),   "Minn"    },
             {new Double(1),  new Double(52.1),   "Phoenix" },
             {new Double(2),  new Double(42.2),   "Raleigh" },
             {new Double(2),  new Double(16.5),   "Minn"    },
             {new Double(2),  new Double(55.1),   "Phoenix" },
             {new Double(3),  new Double(49.2),   "Raleigh" },
             {new Double(3),  new Double(28.3),   "Minn"    },
             {new Double(3),  new Double(59.7),   "Phoenix" },
             {new Double(4),  new Double(59.5),   "Raleigh" },
             {new Double(4),  new Double(45.1),   "Minn"    },
             {new Double(4),  new Double(67.7),   "Phoenix" },
             {new Double(5),  new Double(67.4),   "Raleigh" },
             {new Double(5),  new Double(57.1),   "Minn"    },
             {new Double(5),  new Double(76.3),   "Phoenix" },
             {new Double(6),  new Double(74.4),   "Raleigh" },
             {new Double(6),  new Double(66.9),   "Minn"    },
             {new Double(6),  new Double(84.6),   "Phoenix" },
             {new Double(7),  new Double(77.5),   "Raleigh" },
             {new Double(7),  new Double(71.9),   "Minn"    },
             {new Double(7),  new Double(91.2),   "Phoenix" },
             {new Double(8),  new Double(76.5),   "Raleigh" },
             {new Double(8),  new Double(70.2),   "Minn"    },
             {new Double(8),  new Double(89.1),   "Phoenix" },
             {new Double(9),  new Double(70.6),   "Raleigh" },
             {new Double(9),  new Double(60.0),   "Minn"    },
             {new Double(9),  new Double(83.8),   "Phoenix" },
             {new Double(10), new Double(60.2),   "Raleigh" },
             {new Double(10), new Double(50.0),   "Minn"    },
             {new Double(10), new Double(72.2),   "Phoenix" },
             {new Double(11), new Double(50.0),   "Raleigh" },
             {new Double(11), new Double(32.4),   "Minn"    },
             {new Double(11), new Double(59.8),   "Phoenix" },
             {new Double(12), new Double(41.2),   "Raleigh" },
             {new Double(12), new Double(18.6),   "Minn"    },
             {new Double(12), new Double(52.5),   "Phoenix" }
           };
           setDataVector(data, columnNames);
         }
         public Class getColumnClass(int column) {
           return columnClass[column];
         }
       }
      public static void main(String[] args) {
      	  JFrame frame = new JFrame("BIP Graph Sample");
      	  Container container = frame.getContentPane();
          container.setLayout(new BorderLayout());
          container.setBackground(Color.white);

          JPanel bipPanel = new JPanel();
          bipPanel.setLayout(new BorderLayout());
          SpecifyColumns  bipGraphSample = new SpecifyColumns ();

          bipPanel.add(bipGraphSample, BorderLayout.CENTER);
          container.add(bipPanel, BorderLayout.CENTER);

          frame.setSize(900,450);
          frame.addWindowListener(new WindowAdapter() {
              public void windowClosing(WindowEvent e) {
                     System.exit(0);
              }
          } );
          frame.setVisible(true);
      }
   }