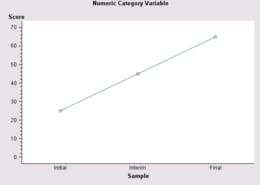
// NumericCategoryVar:
// When using a numeric variable for the Category role, you can define a SAS
// format that categorizes the values for midpointing. Then specify that format
// as an argument on the ClassificationVariable's constructor.

   import com.sas.graphics.components.linechart.LineChart;
   import com.sas.graphics.components.linechart.LineChartTableDataModel;
   import com.sas.graphics.components.AnalysisVariable;
   import com.sas.graphics.components.ClassificationVariable;
   import java.awt.BorderLayout;
   import java.awt.Color;
   import java.awt.Container;
   import java.awt.event.WindowAdapter;
   import java.awt.event.WindowEvent;
   import javax.swing.JFrame;
   import javax.swing.JPanel;
   import javax.swing.table.DefaultTableModel;

   public class NumericCategoryVar extends JPanel  {
     private NumericCategoryVar  theApp;
     public NumericCategoryVar () {
        setLayout(new BorderLayout());

     // Assign a format to numeric variable
        ClassificationVariable myFormattedVar=null;
        try {
             com.sas.text.SASUserDefinedFormat.createFormat(
                 "value myFormat 1 - 2 = 'Initial'"
                 +              "3 - 4 = 'Interim'"
                 +              "5 - 6 = 'Final'");
            } catch (java.text.ParseException e) {
                java.lang.System.out.println("error=" + e.getMessage());
              }
        myFormattedVar= new ClassificationVariable("Sample","myFormat");

     // Create a LineChart and a data source
        LineChart lineChart=new LineChart();
        SampleData dataTable=new SampleData();

     // Create a data model and attach the data source
        LineChartTableDataModel dataModel=
                  new LineChartTableDataModel();
        dataModel.setModel(dataTable);

      // Assign the Category and Response variable roles
         dataModel.setCategoryVariable(myFormattedVar);
         dataModel.setResponseVariable(
                  new AnalysisVariable("Score"));

     // Assign the data model to the LineChart
        lineChart.setDataModel(dataModel);

     // Set a graph title
        lineChart.getTitle1().setText("Numeric Category Variable");

        add(lineChart, BorderLayout.CENTER);
      }
   // Create the data source
      static private class SampleData extends DefaultTableModel {
        private static Class  columnClass[]={Double.class, Double.class};
        private static String columnNames[]={"Score","Sample"};
          public SampleData() {
	    super();
            Object data[][] = {
              {new Double(10.0), new Double(1) },
              {new Double(15.0), new Double(2) },
              {new Double(20.0), new Double(3) },
              {new Double(25.0), new Double(4) },
              {new Double(30.0), new Double(5) },
              {new Double(35.0), new Double(6) },
            };
            setDataVector(data, columnNames);
          }
          public Class getColumnClass(int column) {
	    return columnClass[column];
	  }
      }
      public static void main(String[] args) {
      	  JFrame frame = new JFrame("BIP Graph Sample");
      	  Container container = frame.getContentPane();
          container.setLayout(new BorderLayout());
          container.setBackground(Color.white);

          JPanel bipPanel = new JPanel();
          bipPanel.setLayout(new BorderLayout());
          NumericCategoryVar  bipGraphSample = new NumericCategoryVar ();

          bipPanel.add(bipGraphSample, BorderLayout.CENTER);
          container.add(bipPanel, BorderLayout.CENTER);

          frame.setSize(600,450);
          frame.addWindowListener(new WindowAdapter() {
              public void windowClosing(WindowEvent e) {
                     System.exit(0);
              }
          } );
          frame.setVisible(true);
      }
   }