// ChangeAxis:
// A graph's display properties (axis characteristics, orientation, and
// so on) are general properties that are defined in the graph's model.
// Thus, to change a LineChart's axis characteristics,
// 1) Create an AxisModel and any other objects needed to define
// axis characteristics (line style, tick intervals, ...)
// 2) Use the LineChart to set the axis definitions on the chart
// This example creates a StrokeLineStyle to define a
// 3pt solid red line for both the Category and Response axes.
// It creates an AxisModel to set an axis label and define
// a line style and tick characteristics for the Response axis.
import com.sas.graphics.components.linechart.LineChart;
import com.sas.graphics.components.linechart.LineChartTableDataModel;
import com.sas.graphics.components.AnalysisVariable;
import com.sas.graphics.components.ClassificationVariable;
import com.sas.graphics.components.linechart.LineChartModel;
import com.sas.graphics.components.AxisModel;
import com.sas.graphics.components.GraphConstants;
import com.sas.graphics.components.StrokeLineStyle;
import com.sas.measures.BaseLength;
import java.awt.BorderLayout;
import java.awt.Color;
import java.awt.Container;
import java.awt.event.WindowAdapter;
import java.awt.event.WindowEvent;
import javax.swing.JFrame;
import javax.swing.JPanel;
import javax.swing.table.DefaultTableModel;
public class ChangeAxis extends JPanel {
private ChangeAxis theApp;
public ChangeAxis () {
setLayout(new BorderLayout());
// Create a LineChart and a data source
LineChart lineChart=new LineChart();
SampleData dataTable=new SampleData();
// 1) Create the objects needed to define axis characteristics.
// A StrokeLineStyle is needed to define line characteristics
// for both axes
StrokeLineStyle lineStyle=new StrokeLineStyle(
StrokeLineStyle.SASGRAPH_LINE01,
Color.red,
new BaseLength(3, "pt"),
GraphConstants.TRUE);
// An AxisModel is needed to set an axis label and define
// a line style and tick characteristics for the Response axis
AxisModel rAxis = new AxisModel();
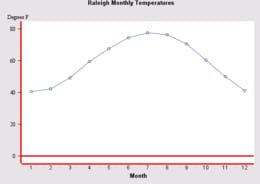
rAxis.setLabel("Degrees F");
rAxis.setAxisLineStyle(lineStyle);
rAxis.setContinuousMajorTickPositionPolicy(
GraphConstants.TICK_POSITION_INTERVAL);
rAxis.setContinuousMajorTickInterval(20);
rAxis.getMinorTickStyle().getLineStyle()
.setVisibilityPolicy(GraphConstants.FALSE);
// 2) Use the LineChart to set the axis definitions on the chart
// Set the line color on the Category axis
lineChart.getGraphModel().getCategoryAxisModel()
.setAxisLineStyle(lineStyle);
// Set the AxisModel on the Response axis
lineChart.getGraphModel().setResponseAxisModel(rAxis);
// Create a data model and attach the data source
LineChartTableDataModel dataModel=
new LineChartTableDataModel(dataTable);
// Assign the Category and Response variable roles
dataModel.setCategoryVariable(
new ClassificationVariable("Month"));
dataModel.setResponseVariable(
new AnalysisVariable("Temp"));
// Assign the data model to the LineChart
lineChart.setDataModel(dataModel);
// Set a graph title
lineChart.getTitle1().setText(
"Raleigh Monthly Temperatures");
add(lineChart, BorderLayout.CENTER);
}
// Create the data source
static private class SampleData extends DefaultTableModel {
private static Class columnClass[]={
Double.class, Double.class};
private static String columnNames[]={
"Month","Temp"};
public SampleData() {
super();
Object data[][] = {
{new Double(1), new Double(40.5) },
{new Double(2), new Double(42.2) },
{new Double(3), new Double(49.2) },
{new Double(4), new Double(59.5) },
{new Double(5), new Double(67.4) },
{new Double(6), new Double(74.4) },
{new Double(7), new Double(77.5) },
{new Double(8), new Double(76.5) },
{new Double(9), new Double(70.6) },
{new Double(10), new Double(60.2) },
{new Double(11), new Double(50.0) },
{new Double(12), new Double(41.2) }
};
setDataVector(data, columnNames);
}
public Class getColumnClass(int column) {
return columnClass[column];
}
}
public static void main(String[] args) {
JFrame frame = new JFrame("BIP Graph Sample");
Container container = frame.getContentPane();
container.setLayout(new BorderLayout());
container.setBackground(Color.white);
JPanel bipPanel = new JPanel();
bipPanel.setLayout(new BorderLayout());
ChangeAxis bipGraphSample = new ChangeAxis ();
bipPanel.add(bipGraphSample, BorderLayout.CENTER);
container.add(bipPanel, BorderLayout.CENTER);
frame.setSize(600,450);
frame.addWindowListener(new WindowAdapter() {
public void windowClosing(WindowEvent e) {
System.exit(0);
}
} );
frame.setVisible(true);
}
}