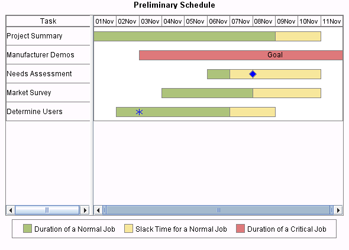
// ShowAnnotations:
// To show annotations in a chart, the annotation information must be in a
// data file that associates the annotations with the appropriate tasks.
// You can then create a GanttChartAnnotationTableDataModel and use it to
// set the annotations on the graph.

   import com.sas.graphics.components.ganttchart.GanttChart;
   import com.sas.graphics.components.ganttchart.GanttChartModel;
   import com.sas.graphics.components.ganttchart.GanttChartTableDataModel;
   import com.sas.graphics.components.GraphStyle;
   import com.sas.graphics.components.ganttchart.GanttChartAnnotationTableDataModel;
   import com.sas.graphics.components.MarkerStyle;
   import com.sas.graphics.components.CompoundTimeAxisModel;
   import com.sas.graphics.components.TimePeriodModel;
   import com.sas.graphics.components.TimeLength;
   import com.sas.graphics.components.GraphConstants;
   import com.sas.graphics.components.TableAxisModel;
   import com.sas.graphics.components.TableAxisColumn;
   import com.sas.measures.BaseLength;
   import com.sas.graphics.components.Variable;
   import javax.swing.table.DefaultTableModel;
   import java.awt.BorderLayout;
   import java.awt.Color;
   import java.awt.Container;
   import java.awt.event.WindowAdapter;
   import java.awt.event.WindowEvent;
   import javax.swing.JFrame;
   import javax.swing.JPanel;

   public class ShowAnnotations extends JPanel  {
     private ShowAnnotations theApp;
     public ShowAnnotations() {
        setLayout(new BorderLayout());

     // Create data sources for the schedule data and annotation data
        ScheduleData dataTable=new ScheduleData();  // defined below
        AnnoData annoTable=new AnnoData();

     // Construct a data model that uses the schedule data
        GanttChartTableDataModel dataModel=
          new GanttChartTableDataModel(dataTable);

     // Create an annotation data model and set it on the schedule data model
        GanttChartAnnotationTableDataModel annoModel=
          new GanttChartAnnotationTableDataModel(annoTable);
        dataModel.setAnnotationTableDataModel(annoModel);

     // Define formats for all date variables
        String format = "DATE5.";
        String informat = "DATE5.";

     // Assign the Task and date variable roles to the annotation data model
        annoModel.setTaskVariable(new Variable("Task"));
        annoModel.setSymbolVariable(new Variable("Symbol"));
        annoModel.setSymbolColorVariable(new Variable("Color"));
        annoModel.setPositionVariable(new Variable("AbsoluteMarker", format, informat,"AbsoluteMarker"));
        annoModel.setLocationVariable(new Variable("RelativeMarker"));
        annoModel.setLabelVariable(new Variable("Label"));
        annoModel.setLabelColorVariable(new Variable("Color"));

     // Assign the Task and date variable roles to the schedule data model
        dataModel.setTaskVariable(new Variable("Task"));
        dataModel.setEarlyStartVariable(new Variable("EarlyStart", format, informat, "Early Start"));
        dataModel.setEarlyFinishVariable(new Variable("EarlyFinish", format, informat, "Early Finish"));
        dataModel.setLateStartVariable(new Variable("LateStart", format, informat, "Late Start"));
        dataModel.setLateFinishVariable(new Variable("LateFinish", format, informat, "Late Finish"));

     // Construct a GanttChart using the data model and assigning the GANTTCHART graph style
        GanttChart ganttChart=new GanttChart(dataModel, new GraphStyle(GraphStyle.STYLE_GANTTCHART));

     // Get the Date axis and change its characteristics
        GanttChartModel ganttChartModel = ganttChart.getGraphModel();
        CompoundTimeAxisModel dateAxis = ganttChartModel.getDateAxisModel();
        TimePeriodModel period1 = dateAxis.getTimePeriodModel1();
        period1.setTimeLength(new TimeLength(1, GraphConstants.TIME_INTERVAL_DAY));
        dateAxis.getTimePeriodModel2().setVisible(false);
        dateAxis.getTimePeriodModel3().setVisible(false);

     // Get the task axis and change its characteristics
        TableAxisModel tableAxisModel = ganttChartModel.getTableAxisModel();
         TableAxisColumn tac[] = new TableAxisColumn[1];
           tac[0] = new TableAxisColumn(new Variable("Task"));
           tac[0].setWidth(new BaseLength(1.5, "in"));
         tableAxisModel.setColumns(tac);

     // Set a graph title
        ganttChart.getTitle1().setText("Preliminary Schedule");
        add(ganttChart, BorderLayout.CENTER);
      }
  // Create the data source
     static private class ScheduleData extends DefaultTableModel {
       private static Class  columnClass[]={
                   String.class, String.class, String.class, String.class, String.class};
       private static String columnNames[]={
                  "Task", "EarlyStart", "LateStart", "EarlyFinish", "LateFinish"};
         public ScheduleData() {
	   super();
           Object data[][] = {
             {new String("Project Summary")   , new String("01NOV"), new String("02NOV"), new String("09NOV"), new String("11NOV") },
             {new String("Manufacturer Demos"), new String("03NOV"), new String("05NOV"), new String("12NOV"), new String("12NOV") },
             {new String("Needs Assessment")  , new String("06NOV"), new String("08NOV"), new String("07NOV"), new String("11NOV") },
             {new String("Market Survey")     , new String("04NOV"), new String("06NOV"), new String("08NOV"), new String("11NOV") },
             {new String("Determine Users")   , new String("02NOV"), new String("06NOV"), new String("07NOV"), new String("09NOV") }
           };
           setDataVector(data, columnNames);
         }
         public Class getColumnClass(int column) {
           return columnClass[column];
         }
       }
  // Create the annotation data source
     static private class AnnoData extends DefaultTableModel {
       private static Class  columnClass[]={
                   String.class, Integer.class, String.class, String.class, String.class, String.class};
       private static String columnNames[]={
                  "Task", "Symbol", "Color", "AbsoluteMarker", "RelativeMarker", "Label"};
         public AnnoData() {
	   super();
           Object data[][] = {
             {new String("Needs Assessment")
                , new Integer(MarkerStyle.SYMBOL_DIAMOND_FILLED)
                , new String("blue")
                , null                   // position value
                , new String("LS")       // location value
                , null },
             {new String("Determine Users")
                , new Integer(MarkerStyle.SYMBOL_ASTERISK )
                , new String("blue")
                , new String("03NOV")    // position value
                , null                   // location value
                , null },
             {new String("Manufacturer Demos")
                , null
                , new String("darkGray")
                , new String("09NOV")   // position value
                , null                  // location value
                , new String("Goal") }
           };
           setDataVector(data, columnNames);
         }
         public Class getColumnClass(int column) {
           return columnClass[column];
         }
       }
       public static void main(String[] args) {
      	  JFrame frame = new JFrame("BIP Graph Sample");
      	  Container container = frame.getContentPane();
          container.setLayout(new BorderLayout());
          container.setBackground(Color.white);

          JPanel bipPanel = new JPanel();
          bipPanel.setLayout(new BorderLayout());
          ShowAnnotations  bipGraphSample = new ShowAnnotations();

          bipPanel.add(bipGraphSample, BorderLayout.CENTER);
          container.add(bipPanel, BorderLayout.CENTER);

          frame.setSize(600,450);
          frame.addWindowListener(new WindowAdapter() {
              public void windowClosing(WindowEvent e) {
                     System.exit(0);
              }
          } );
          frame.setVisible(true);
       }
     }