Sample 62823: Adding an aggregated measure to treemap labels in a SAS® Visual Analytics report
 |  |  |
Overview
On a treemap in a SAS Visual Analytics report, only the value of the category assigned to the Tile role appears in the tile label. The only way to see other values is to add data items to the Data tip values role. In this case, you must position your cursor over the tile to see the additional information.
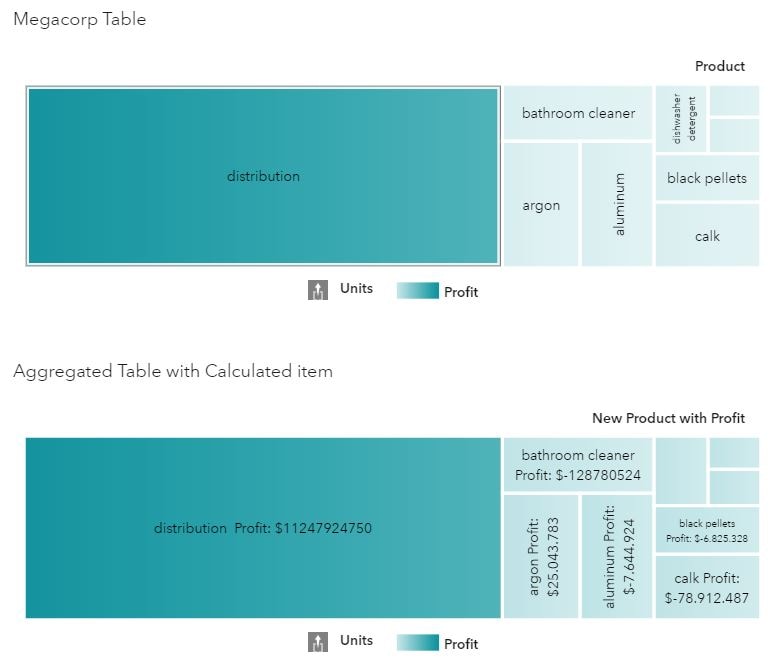
However, sometimes you want the tile label to also include the value of an aggregated measure. This sample explains the steps needed to add the value of an aggregated measure named Profit to the Product name on tiles in a treemap.
Note: This sample applies to release 8.3 or later because it takes advantage of features that are new in 8.3.
In the following display, the first image shows the treemap with only Product values on the tiles. The second image shows the Product values with the aggregated measure Profit.

Create an Aggregated Data Source
First, you must create an aggregated data source in the report. Here are the steps:
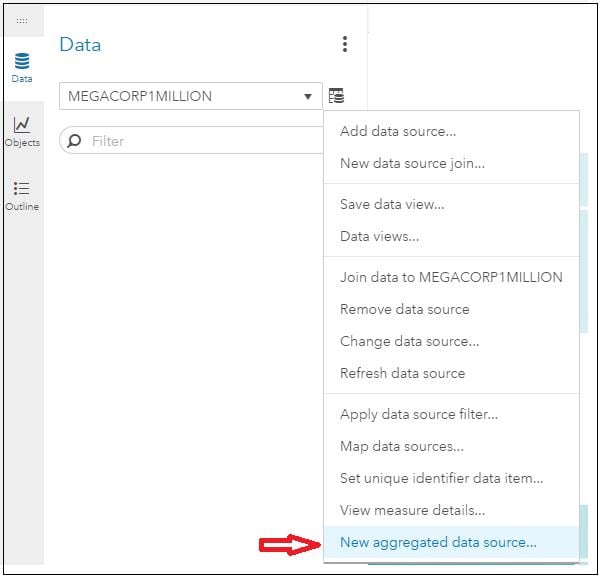
- On the Data pane, click the Actions icon and select New aggregated data source.

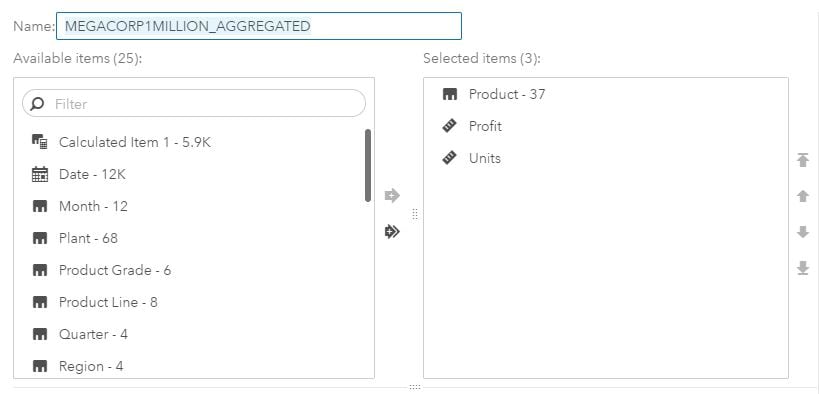
- Select the data items that you would like to keep in this new temporary table. Include any data items that you also want to display in the data tip. In the following display, Product, Profit, and Units are included in the table. Click OK.

Create a New Calculated Item
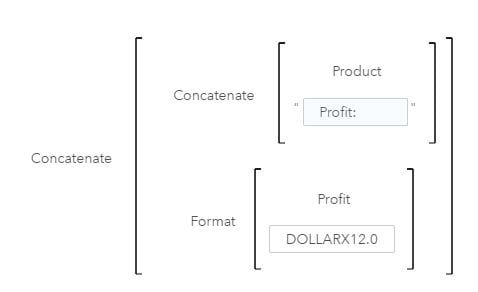
After you create the aggregated table, you must create a new calculated item that concatenates the category (Product) with the aggregated measure (Profit).
- On the Data pane, click New data item, and then select Calculated item.
- In the expression editor, create an expression that uses the Concatenate operator. In the following display, the value of Product is concatenated with the text Profit: and then the value of Profit. The Format operator converts the numeric measure (Profit) to character. This is required in order to use Profit with the Concatenate operator.

Use the New Data Item in the Tile Role
To use the new data item in the Tile role, you must either remove all data items currently assigned to the treemap, or create a new treemap.
- On the Data pane, select the aggregated table.
- Add a new treemap to the report.
- On the Roles tab, assign the new calculated data item to the Tile role.
Documentation Resources
For links to all of the available documentation for SAS Visual Analytics, see the SAS Visual Analytics Product Documentation page.
These sample files and code examples are provided by SAS Institute Inc. "as is" without warranty of any kind, either express or implied, including but not limited to the implied warranties of merchantability and fitness for a particular purpose. Recipients acknowledge and agree that SAS Institute shall not be liable for any damages whatsoever arising out of their use of this material. In addition, SAS Institute will provide no support for the materials contained herein.
These sample files and code examples are provided by SAS Institute Inc. "as is" without warranty of any kind, either express or implied, including but not limited to the implied warranties of merchantability and fitness for a particular purpose. Recipients acknowledge and agree that SAS Institute shall not be liable for any damages whatsoever arising out of their use of this material. In addition, SAS Institute will provide no support for the materials contained herein.
| Type: | Sample |
| Date Modified: | 2018-08-30 10:41:24 |
| Date Created: | 2018-08-24 13:56:52 |
Operating System and Release Information
| Product Family | Product | Host | Product Release | SAS Release | ||
| Starting | Ending | Starting | Ending | |||
| SAS System | SAS Visual Analytics | Linux for x64 | 8.3 | Viya | ||