Problem Note 62309: SAS® Visual Analytics reports might unexpectedly include indirect filters
 |  |  |
SAS Visual Analytics enables you to create interactions between report objects. For example, you could specify to filter a bar chart based on selections in a list table. Depending on how many objects are in the report section and how many actions you have defined, sometimes objects have indirect filters.
For example, the following display shows three objects in the Actions Diagram, which is a thumbnail view of interactions between report objects. The list table filters the bar chart, and the bar chart filters the pie chart. This workflow includes an indirect filter between the list table and the pie chart because the bar chart is first filtered by the list table.
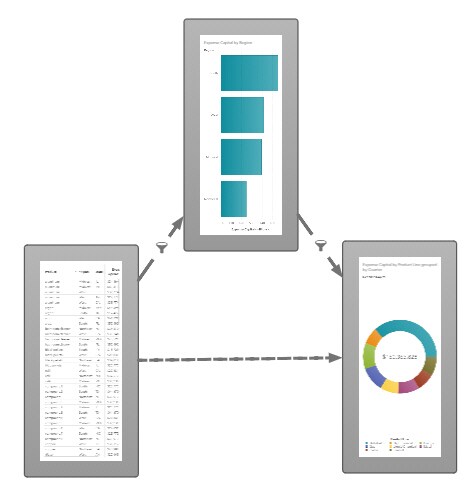
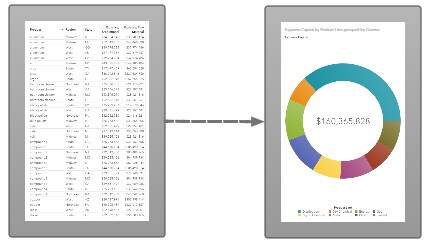
If you delete the bar chart, the indirect filter between the list table and the pie chart should be removed. However, the indirect filter might remain, as shown in the following display. In this case, the list table continues to filter the pie chart, which is unexpected since the source of the filter has been removed.
This indirect filter is not visible on the Actions pane, so you cannot delete it from there. To remove the indirect filter, open the Actions pane for one of the objects. Select the Automatic actions on all objects option and then deselect it. Open the Actions Diagram. The indirect filter should be gone.
Operating System and Release Information
| Product Family | Product | System | Product Release | SAS Release | ||
| Reported | Fixed* | Reported | Fixed* | |||
| SAS System | SAS Visual Analytics | Linux for x64 | 8.2 | 8.3 | Viya | Viya |
| Type: | Problem Note |
| Priority: | medium |
| Date Modified: | 2018-05-11 14:36:18 |
| Date Created: | 2018-05-11 10:26:42 |