Usage Note 61560: In SAS® Visual Analytics, stacked bar charts with more than one measure might split into multiple charts
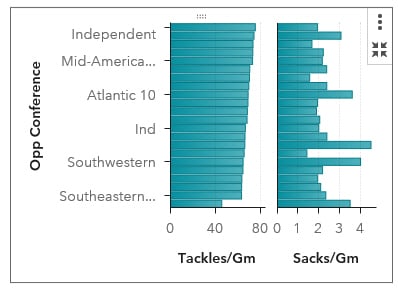
By default, the Measure Layout option for a bar chart is set to Automatic. When the setting is Automatic, SAS Visual Analytics considers the format and range of values to determine whether the measures can use a shared axis. If SAS Visual Analytics determines that they cannot use a shared axis, the stacked bar chart splits into two individual charts as shown in the following display:
To force the use of a shared axis, select the chart, open the Options pane, and change the Measure Layout to Shared Axis.
Operating System and Release Information
| SAS System | SAS Visual Analytics | Microsoft® Windows® for x64 | 8.2 | | Viya | |
| Linux for x64 | 8.2 | | Viya | |
*
For software releases that are not yet generally available, the Fixed
Release is the software release in which the problem is planned to be
fixed.
| Date Modified: | 2017-12-13 10:29:58 |
| Date Created: | 2017-12-13 10:18:33 |


