Usage Note 57113: Constructing panels of statistical plots and/or tables
 |  |  |
When a statistical analysis produces several related plots and/or tables, you might want to group them into a single panel of items so that they can easily be viewed together. In many cases, a statistical procedure automatically produces a panel of related plots. For example, PROC REG generates this panel of diagnostic plots and information summarizing a linear regression model. As a single panel, it is much easier to assess the fit of the model.

|
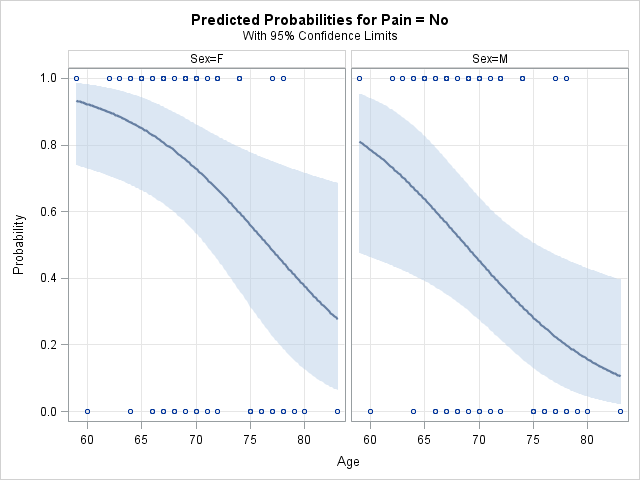
Many sets of plots requested by the PLOTS= option or the EFFECTPLOT statement are displayed as a panel by default. For example, the following EFFECTPLOT statement produces a panel of effect plots for the Age predictor at each Sex level. This example uses the analgesic data found in the example titled "Logistic Modeling with Categorical Predictors" in the LOGISTIC procedure documentation.
      proc logistic data=Neuralgia;
         class Sex / param=ref;
         model Pain=Sex Age;
         effectplot fit(x=age) / at(Sex=all);
         run;
|
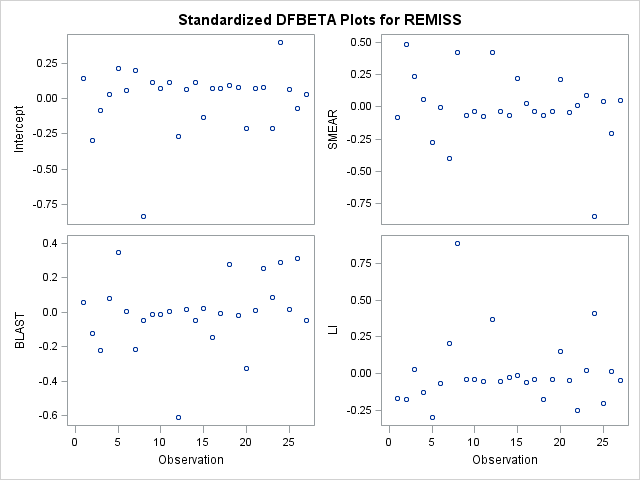
Similarly, in PROC GENMOD, the PLOTS=DFBETAS option produces a panel of plots showing the β deletion statistic for each predictor in the model. This uses the remission data in the example titled "Stepwise Logistic Regression and Predicted Values" in the LOGISTIC procedure documentation.
      proc genmod data=Remission plots=dfbetas;
         model remiss=smear blast li / dist=binomial;
         run;
|
A panel of plots can be divided into a set of separate, full-size plots by specifying the UNPACK option in the PLOTS option or in the EFFECTPLOT statement. For example,
plots(unpack)=dfbetas
or
effectplot fit(x=age) / at(Sex=all) unpack;
Note that many procedures produce plots automaticallyNote. You can also request plots using other options and statements such as the ESTIMATE, LSMEANS, LSMESTIMATE, and SLICE statements available in many procedures, as well as procedure-specific statements like the ROC and ODDSRATIO statements in PROC LOGISTIC. Procedures often display certain sets of plots (usually plots of the same type) in a panel, such as the examples above. Unrelated plots are generally not paneled by the procedure. But you can combine any arbitrary set of plots, or even a combination of plots and tables, into a panel using ODS LAYOUT.
One typical application is to produce a panel of effect plots for all of the predictors in a regression model. This cannot be done using the PLOTS= option in PROC REG. An efficient way to produce the panel uses ODS LAYOUT and PROC PLM as illustrated below. The first step is to fit and save the model. You then run PROC PLM multiple times within a layout defined by the ODS LAYOUT statement. The EFFECTPLOT statement is used in each PLM step to produce one plot. The cells of the layout are demarcated by ODS REGION statements. Note that the model is fit with PROC ORTHOREG, rather than PROC REG, so that the EFFECTPLOT statement can be used in PROC PLM.
The following statements fit the model. The STORE statement saves the model to an item store for use by PROC PLM. The parameter estimates of the model are also saved in a data set with the ODS OUTPUT statement for later display in the panel.
      proc orthoreg data=fitness;
         model Oxygen=Age Weight RunTime RunPulse MaxPulse;
         store out=regmod;
         ods output ParameterEstimates=pe;
         run;
The following produces the panel of effect plots. The ODS GRAPHICS statement defines a smaller size for the plots. The default size is reset by the second ODS GRAPHICS statement at the end. ODS NOPROCTITLE suppresses the procedure name from appearing as a title in every plot. Procedure name titles are turned back on at the end. The two ODS LAYOUT statements begin and end the definition of a gridded layout that has three columns with the specified gutter size separating rows and columns. Then PROC PLM with an EFFECTPLOT statement for each predictor is run in each cell of the layout. The cells are separated by the ODS REGION statements. The ODS SELECT statement ensures that only the effect plot appears in each cell. The ODS graph name produced by the EFFECTPLOT statement is FITPLOT. ODS table and graph names are shown in procedure documentation. The final cell of the layout is filled with the results of a PROC PRINT step that displays the saved parameter estimates of the model along with their p-values.
An alternative approach would be to simply run PROC ORTHOREG with a single EFFECTPLOT statement in each of the cells of the layout. However, this is less efficient because you would refit the model each time. This could be time-consuming if the data set or model is large.
      ods graphics / height=380 width=380;
      ods noproctitle;
      ods layout gridded columns=3 row_gutter=3mm column_gutter=3mm;
      ods region;
         proc plm source=regmod;
            ods select fitplot;
            effectplot fit(x=Age) / clm;
            run;
      ods region;
         proc plm source=regmod;
            ods select fitplot;
            effectplot fit(x=Weight) / clm;
            run;
      ods region;
         proc plm source=regmod;
            ods select fitplot;
            effectplot fit(x=RunTime) / clm;
            run;
      ods region;
         proc plm source=regmod;
            ods select fitplot;
            effectplot fit(x=RunPulse) / clm;
            run;
      ods region;
         proc plm source=regmod;
            ods select fitplot;
            effectplot fit(x=MaxPulse) / clm;
            run;
      ods region;
         proc print data=pe;
            id parameter;
            var estimate probt;
            format estimate 8.4;
            title "Model Parameter Estimates";
            run;
      ods layout end;
      ods proctitle;
      ods graphics / reset;

|
Another way to produce a panel of plots and tables is to use ODS DOCUMENT and PROC DOCUMENT along with ODS LAYOUT. This is illustrated below. For these data, the predictors are first standardized. PROC LOGISTIC is then used to fit the model, and the PLOTS= options produces a plot of the ROC curve and a plot of the odds ratio estimates for the predictors. A classification table for a range of probability cutoff values between 0 and 1 is also produced by the CTABLE and PPROB= options. The ODS DOCUMENT statements surrounding the PROC LOGISTIC step makes the plots and tables generated by PROC LOGISTIC available for redisplay via the REPLAY statement in PROC DOCUMENT.
      proc standard data=sampsio.hmeq out=hmeq m=0 s=1;
         var Delinq Derog nInq CLAge CLNo DebtInc Loan MortDue;
         run;

      ods noproctitle;
      ods document name=LOGdoc(write);
         proc logistic data=hmeq plots(only)=(roc oddsratio);
            model Bad(event='1') = Delinq Derog nInq CLAge CLNo DebtInc Loan MortDue /
            ctable pprob=(0 to 1 by .1);
            run;
      ods document close;
The contents of the ODS document, including the paths for the objects within it, can be displayed using the LIST statement in PROC DOCUMENT.
      proc document name=logdoc;
         list/levels=all;
         run;
The panel of results is produced by the following statements. As above, the ODS LAYOUT statements define a gridded layout with two columns, each four inches wide. In the cells of the layout, defined by the ODS REGION statements, PROC DOCUMENT replays a specified plot or table for display in that cell.
      ods layout gridded columns=2 column_widths=(4in 4in) rows=2;
      ods region;
         proc document name=LOGdoc;
            replay \Logistic#1\ROCCurve#1;
            run;
      ods region;
         proc document name=LOGdoc;
            replay \Logistic#1\Classification#1;
            run;
      ods region;
         proc document name=LOGdoc;
            replay \Logistic#1\OddsRatios#1;
            run;
      ods region;
         proc document name=LOGdoc;
            replay \Logistic#1\ORPlot#1;
            run;
      ods layout end;
      ods proctitle;

|
You can see another example of using ODS LAYOUT to produce a panel of plots, text, and tables in this note.
__________
Note: ODS Graphics must be on for plots to be produced. ODS Graphics is on by default beginning in SAS® 9.3. ODS Graphics can be turned on with the following statement.
ods graphics on;
Operating System and Release Information
| Product Family | Product | System | SAS Release | |
| Reported | Fixed* | |||
| SAS System | SAS/STAT | z/OS | ||
| z/OS 64-bit | ||||
| OpenVMS VAX | ||||
| Microsoft® Windows® for 64-Bit Itanium-based Systems | ||||
| Microsoft Windows Server 2003 Datacenter 64-bit Edition | ||||
| Microsoft Windows Server 2003 Enterprise 64-bit Edition | ||||
| Microsoft Windows XP 64-bit Edition | ||||
| Microsoft® Windows® for x64 | ||||
| OS/2 | ||||
| Microsoft Windows 8 Enterprise 32-bit | ||||
| Microsoft Windows 8 Enterprise x64 | ||||
| Microsoft Windows 8 Pro 32-bit | ||||
| Microsoft Windows 8 Pro x64 | ||||
| Microsoft Windows 8.1 Enterprise 32-bit | ||||
| Microsoft Windows 8.1 Enterprise x64 | ||||
| Microsoft Windows 8.1 Pro | ||||
| Microsoft Windows 8.1 Pro 32-bit | ||||
| Microsoft Windows 95/98 | ||||
| Microsoft Windows 2000 Advanced Server | ||||
| Microsoft Windows 2000 Datacenter Server | ||||
| Microsoft Windows 2000 Server | ||||
| Microsoft Windows 2000 Professional | ||||
| Microsoft Windows NT Workstation | ||||
| Microsoft Windows Server 2003 Datacenter Edition | ||||
| Microsoft Windows Server 2003 Enterprise Edition | ||||
| Microsoft Windows Server 2003 Standard Edition | ||||
| Microsoft Windows Server 2003 for x64 | ||||
| Microsoft Windows Server 2008 | ||||
| Microsoft Windows Server 2008 R2 | ||||
| Microsoft Windows Server 2008 for x64 | ||||
| Microsoft Windows Server 2012 Datacenter | ||||
| Microsoft Windows Server 2012 R2 Datacenter | ||||
| Microsoft Windows Server 2012 R2 Std | ||||
| Microsoft Windows Server 2012 Std | ||||
| Microsoft Windows XP Professional | ||||
| Windows 7 Enterprise 32 bit | ||||
| Windows 7 Enterprise x64 | ||||
| Windows 7 Home Premium 32 bit | ||||
| Windows 7 Home Premium x64 | ||||
| Windows 7 Professional 32 bit | ||||
| Windows 7 Professional x64 | ||||
| Windows 7 Ultimate 32 bit | ||||
| Windows 7 Ultimate x64 | ||||
| Windows Millennium Edition (Me) | ||||
| Windows Vista | ||||
| Windows Vista for x64 | ||||
| 64-bit Enabled AIX | ||||
| 64-bit Enabled HP-UX | ||||
| 64-bit Enabled Solaris | ||||
| ABI+ for Intel Architecture | ||||
| AIX | ||||
| HP-UX | ||||
| HP-UX IPF | ||||
| IRIX | ||||
| Linux | ||||
| Linux for x64 | ||||
| Linux on Itanium | ||||
| OpenVMS Alpha | ||||
| OpenVMS on HP Integrity | ||||
| Solaris | ||||
| Solaris for x64 | ||||
| Tru64 UNIX | ||||
| SAS System | Base SAS | Aster Data nCluster on Linux x64 | ||
| DB2 Universal Database on AIX | ||||
| DB2 Universal Database on Linux x64 | ||||
| Greenplum on Linux x64 | ||||
| Netezza TwinFin 32bit blade | ||||
| Netezza TwinFin 32-bit SMP Hosts | ||||
| Netezza TwinFin 64-bit S-Blades | ||||
| Netezza TwinFin 64-bit SMP Hosts | ||||
| Teradata on Linux | ||||
| z/OS | ||||
| z/OS 64-bit | ||||
| OpenVMS VAX | ||||
| Microsoft® Windows® for 64-Bit Itanium-based Systems | ||||
| Microsoft Windows Server 2003 Datacenter 64-bit Edition | ||||
| Microsoft Windows Server 2003 Enterprise 64-bit Edition | ||||
| Microsoft Windows XP 64-bit Edition | ||||
| Microsoft® Windows® for x64 | ||||
| OS/2 | ||||
| Microsoft Windows 8 Enterprise 32-bit | ||||
| Microsoft Windows 8 Enterprise x64 | ||||
| Microsoft Windows 8 Pro 32-bit | ||||
| Microsoft Windows 8 Pro x64 | ||||
| Microsoft Windows 8.1 Enterprise 32-bit | ||||
| Microsoft Windows 8.1 Enterprise x64 | ||||
| Microsoft Windows 8.1 Pro | ||||
| Microsoft Windows 8.1 Pro 32-bit | ||||
| Microsoft Windows 95/98 | ||||
| Microsoft Windows 2000 Advanced Server | ||||
| Microsoft Windows 2000 Datacenter Server | ||||
| Microsoft Windows 2000 Server | ||||
| Microsoft Windows 2000 Professional | ||||
| Microsoft Windows NT Workstation | ||||
| Microsoft Windows Server 2003 Datacenter Edition | ||||
| Microsoft Windows Server 2003 Enterprise Edition | ||||
| Microsoft Windows Server 2003 Standard Edition | ||||
| Microsoft Windows Server 2003 for x64 | ||||
| Microsoft Windows Server 2008 | ||||
| Microsoft Windows Server 2008 R2 | ||||
| Microsoft Windows Server 2008 for x64 | ||||
| Microsoft Windows Server 2012 Datacenter | ||||
| Microsoft Windows Server 2012 R2 Datacenter | ||||
| Microsoft Windows Server 2012 R2 Std | ||||
| Microsoft Windows Server 2012 Std | ||||
| Microsoft Windows XP Professional | ||||
| Windows 7 Enterprise 32 bit | ||||
| Windows 7 Enterprise x64 | ||||
| Windows 7 Home Premium 32 bit | ||||
| Windows 7 Home Premium x64 | ||||
| Windows 7 Professional 32 bit | ||||
| Windows 7 Professional x64 | ||||
| Windows 7 Ultimate 32 bit | ||||
| Windows 7 Ultimate x64 | ||||
| Windows Millennium Edition (Me) | ||||
| Windows Vista | ||||
| Windows Vista for x64 | ||||
| 64-bit Enabled AIX | ||||
| 64-bit Enabled HP-UX | ||||
| 64-bit Enabled Solaris | ||||
| ABI+ for Intel Architecture | ||||
| AIX | ||||
| HP-UX | ||||
| HP-UX IPF | ||||
| IRIX | ||||
| Linux | ||||
| Linux for x64 | ||||
| Linux on Itanium | ||||
| OpenVMS Alpha | ||||
| OpenVMS on HP Integrity | ||||
| Solaris | ||||
| Solaris for x64 | ||||
| Tru64 UNIX | ||||
| Type: | Usage Note |
| Priority: | |
| Topic: | Analytics ==> Statistical Graphics Analytics ==> analytics SAS Reference ==> Statements ==> ODS: Output Control ==> ODS PROCTITLE SAS Reference ==> ODS (Output Delivery System) SAS Reference ==> Statements ==> ODS: SAS Formatted ==> ODS DOCUMENT SAS Reference ==> Procedures ==> DOCUMENT |
| Date Modified: | 2016-01-06 11:15:53 |
| Date Created: | 2015-11-19 10:44:04 |