Sample 49697: Add a table beneath a graph with the Graph Template Language (GTL)
The sample code on the
Full Code tab illustrates how to use the Graph Template Language (GTL) to add a table beneath a graph. The code defines a cell for the graph and a separate cell for a table beneath the graph within a LAYOUT LATTICE block. The ROWWEIGHTS= option in the LAYOUT LATTICE statement defines the size of the cells. The GROUP= option in the BARCHART statement is assigned the midpoint variable so that each bar is a different color. Specifying DISPLAY=(LABEL) in the XAXISOPTS parameter in the second LAYOUT OVERLAY statement suppresses the X-axis values and tick marks on the block plot.
These sample files and code examples are provided by SAS Institute
Inc. "as is" without warranty of any kind, either express or implied, including
but not limited to the implied warranties of merchantability and fitness for a
particular purpose. Recipients acknowledge and agree that SAS Institute shall
not be liable for any damages whatsoever arising out of their use of this material.
In addition, SAS Institute will provide no support for the materials contained herein.
The sample code below illustrates how to use the Graph Template Language (GTL) to add a table beneath a graph. The code defines a cell for the graph and a separate cell for a table beneath the graph within a LAYOUT LATTICE block. The ROWWEIGHTS= option in the LAYOUT LATTICE statement defines the size of the cells. The GROUP= option in the BARCHART statement is assigned the midpoint variable so that each bar is a different color. Specifying DISPLAY=(LABEL) in the XAXISOPTS parameter in the second LAYOUT OVERLAY statement suppresses the X-axis values and tick marks on the block plot.
proc template;
   define statgraph barblock;
   begingraph;
      entrytitle 'Total Sales Across Regions';
      layout lattice / rowweights=(.65 .35);
         layout overlay;
	    barchart x=region y=sales / group=region barlabel=true dataskin=gloss;
	 endlayout;
	 layout overlay / xaxisopts=(type=discrete label='Number of Stores per Region'
                          display=(label)) walldisplay=none;
	    blockplot x=region block=stores / class=product display=(outline values label)
                                              repeatedvalues=true;
	 endlayout;
      endlayout;
   endgraph;
   end;
run;

proc sort data=sashelp.shoes out=new;
   by region product;
run;

proc means data=new noprint;
   where region in('Africa' 'Asia' 'Canada' 'Pacific' 'United States');
   id sales;
   by region product;
   var stores;
   output out=shoes sum=;
run;

proc sgrender data=shoes template=barblock;
run;
These sample files and code examples are provided by SAS Institute
Inc. "as is" without warranty of any kind, either express or implied, including
but not limited to the implied warranties of merchantability and fitness for a
particular purpose. Recipients acknowledge and agree that SAS Institute shall
not be liable for any damages whatsoever arising out of their use of this material.
In addition, SAS Institute will provide no support for the materials contained herein.
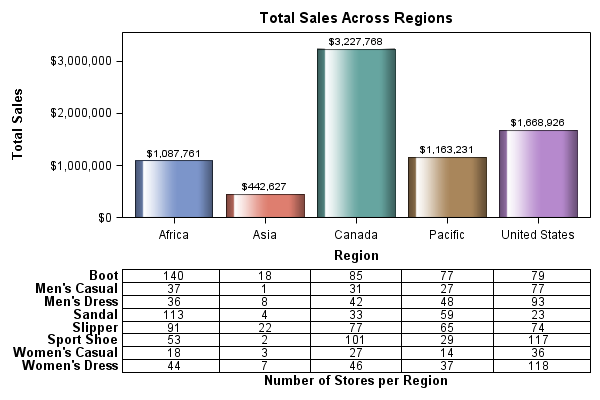
This sample illustrates how to add a table beneath a graph using the Graph Template Language (GTL).
| Type: | Sample |
| Topic: | SAS Reference ==> Procedures ==> SGRENDER
|
| Date Modified: | 2013-04-30 15:46:17 |
| Date Created: | 2013-04-19 12:20:31 |
Operating System and Release Information
| SAS System | Base SAS | Microsoft Windows Server 2008 | 9.3 TS1M0 | |
| Microsoft Windows Server 2003 for x64 | 9.3 TS1M0 | |
| Microsoft Windows Server 2003 Standard Edition | 9.3 TS1M0 | |
| Microsoft Windows Server 2003 Enterprise Edition | 9.3 TS1M0 | |
| Microsoft Windows Server 2003 Datacenter Edition | 9.3 TS1M0 | |
| Microsoft® Windows® for x64 | 9.3 TS1M0 | |
| Z64 | 9.3 TS1M0 | |
| z/OS | 9.3 TS1M0 | |
| Teradata on Linux | 9.3 TS1M0 | |
| Netezza TwinFin 64-bit SMP Hosts | 9.3 TS1M0 | |
| Netezza TwinFin 64-bit S-Blades | 9.3 TS1M0 | |
| Netezza TwinFin 32-bit SMP Hosts | 9.3 TS1M0 | |
| Netezza TwinFin 32bit blade | 9.3 TS1M0 | |
| Greenplum on Linux x64 | 9.3 TS1M0 | |
| DB2 Universal Database on Linux x64 | 9.3 TS1M0 | |
| DB2 Universal Database on AIX | 9.3 TS1M0 | |
| Aster Data nCluster on Linux x64 | 9.3 TS1M0 | |
| Microsoft Windows Server 2008 for x64 | 9.3 TS1M0 | |
| Microsoft Windows XP Professional | 9.3 TS1M0 | |
| Windows 7 Enterprise 32 bit | 9.3 TS1M0 | |
| Windows 7 Enterprise x64 | 9.3 TS1M0 | |
| Windows 7 Home Premium 32 bit | 9.3 TS1M0 | |
| Windows 7 Home Premium x64 | 9.3 TS1M0 | |
| Windows 7 Professional 32 bit | 9.3 TS1M0 | |
| Windows 7 Professional x64 | 9.3 TS1M0 | |
| Windows 7 Ultimate 32 bit | 9.3 TS1M0 | |
| Windows 7 Ultimate x64 | 9.3 TS1M0 | |
| Windows Vista | 9.3 TS1M0 | |
| Windows Vista for x64 | 9.3 TS1M0 | |
| 64-bit Enabled AIX | 9.3 TS1M0 | |
| 64-bit Enabled HP-UX | 9.3 TS1M0 | |
| 64-bit Enabled Solaris | 9.3 TS1M0 | |
| HP-UX IPF | 9.3 TS1M0 | |
| Linux | 9.3 TS1M0 | |
| Linux for x64 | 9.3 TS1M0 | |
| Solaris for x64 | 9.3 TS1M0 | |


