Sample 48138: Remove the border around the axis area and make the background white in graphics produced by PROC SGPLOT
The sample code on the
Full Code tab illustrates how to remove the top and right axis lines that are drawn on graphs produced by the SGPLOT procedure. The sample code also shows how to change the color of the graph background.
These sample files and code examples are provided by SAS Institute
Inc. "as is" without warranty of any kind, either express or implied, including
but not limited to the implied warranties of merchantability and fitness for a
particular purpose. Recipients acknowledge and agree that SAS Institute shall
not be liable for any damages whatsoever arising out of their use of this material.
In addition, SAS Institute will provide no support for the materials contained herein.
The top and right axis lines that are drawn on graphs produced by the SGPLOT procedure are part of the frame from the graph wall. You can turn off the frame border using a style definition.
In addition to turning the frame off, you can also change the color of the graph background from gray to white.
Once the style has been defined, you need to point to that style with the STYLE= option in the ODS destination statement. The sample code below illustrates the syntax.
proc template;
   define style mystyle;
   parent=styles.sasweb;
      class graphwalls /
            frameborder=off;
      class graphbackground /
            color=white;
   end;
run;

ods listing close;
ods html style=mystyle path='.' file='newgraph.html';
ods graphics / reset=all border=off width=600px height=400px;

proc sgplot data=sashelp.heart;
   where status in('Alive') and ageatstart < 50;
   title1 'Remove Frame Border & Assign White to Background Color';
   hbar ageatstart / response=weight group=sex;
run;

ods html close;
ods listing;
These sample files and code examples are provided by SAS Institute
Inc. "as is" without warranty of any kind, either express or implied, including
but not limited to the implied warranties of merchantability and fitness for a
particular purpose. Recipients acknowledge and agree that SAS Institute shall
not be liable for any damages whatsoever arising out of their use of this material.
In addition, SAS Institute will provide no support for the materials contained herein.
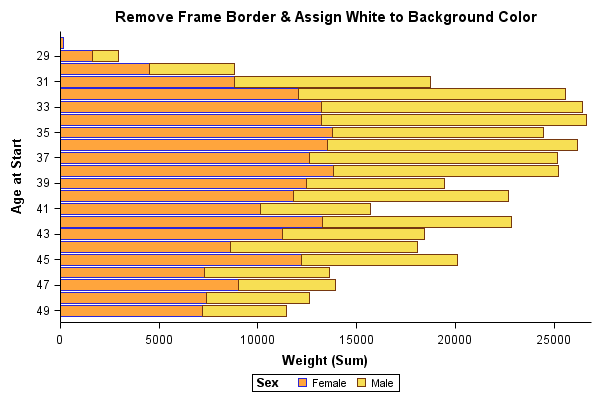
This sample illustrates how to remove the border around the axis area and make the background white in graphics produced by the SGPLOT procedure.
| Date Modified: | 2012-10-26 10:44:13 |
| Date Created: | 2012-10-12 13:00:12 |
Operating System and Release Information
| SAS System | SAS/GRAPH | Microsoft Windows Server 2003 Enterprise 64-bit Edition | 9.2 TS1M0 | |
| Microsoft Windows Server 2003 Datacenter 64-bit Edition | 9.2 TS1M0 | |
| Microsoft® Windows® for 64-Bit Itanium-based Systems | 9.2 TS1M0 | |
| z/OS | 9.2 TS1M0 | |
| Microsoft Windows XP 64-bit Edition | 9.2 TS1M0 | |
| Microsoft® Windows® for x64 | 9.2 TS1M0 | |
| Microsoft Windows Server 2003 Datacenter Edition | 9.2 TS1M0 | |
| Microsoft Windows Server 2003 Enterprise Edition | 9.2 TS1M0 | |
| Microsoft Windows Server 2003 Standard Edition | 9.2 TS1M0 | |
| Microsoft Windows XP Professional | 9.2 TS1M0 | |
| Windows Vista | 9.2 TS1M0 | |
| Windows Vista for x64 | 9.2 TS1M0 | |
| 64-bit Enabled AIX | 9.2 TS1M0 | |
| 64-bit Enabled HP-UX | 9.2 TS1M0 | |
| 64-bit Enabled Solaris | 9.2 TS1M0 | |
| HP-UX IPF | 9.2 TS1M0 | |
| Linux | 9.2 TS1M0 | |
| Linux for x64 | 9.2 TS1M0 | |
| OpenVMS on HP Integrity | 9.2 TS1M0 | |
| Solaris for x64 | 9.2 TS1M0 | |


