Sample 40393: Making multiple stored process graphs print on one page from SAS® Web Report Studio
 |  |  |  |
Overview
In SAS Web Report Studio, you cannot resize objects, such as graphs, that are the result of running a stored process. This means that you might not be able to confine the stored process output to one printed page, even if the output is displayed on one screen. However, if your stored process generates graphs using SAS/GRAPH code, you can add some options to the code in order to control the size of the graphs. This sample uses the SASHELP.CLASS table to demonstrate how to print four graphs on one 8.5 x 11 page. (For the purpose of this sample, the same stored process is used to produce all four graphs.)
Note: This sample was written using SAS Web Report Studio 4.2; however, you should also be able to perform this task in version 3.1.
Original output
The following SAS/GRAPH code uses PROC GPLOT to generate a scatter plot based of Height and Weight by Sex.
*ProcessBody;
%stpbegin;

goptions ftitle="albany amt/bold" ftext="albany amt" gunit=pct htitle=14pt htext=10pt;

symbol1 value=circle height=5 interpol=none color=red;
symbol2 value=X      height=5 interpol=none color=blue;
axis1 order=(50 to 80 by 10) minor=none offset=(3,3);
axis2 order=(50 to 150 by 25) minor=none offset=(3,3);

proc gplot data=sashelp.class;
plot height*weight=sex /
 vaxis=axis1
 haxis=axis2
 autovref cvref=graydd
 autohref chref=graydd
 ;
run;
quit;

%stpend;
|
In SAS Web Report Studio, without size options set, you must use scroll bars to see each graph.
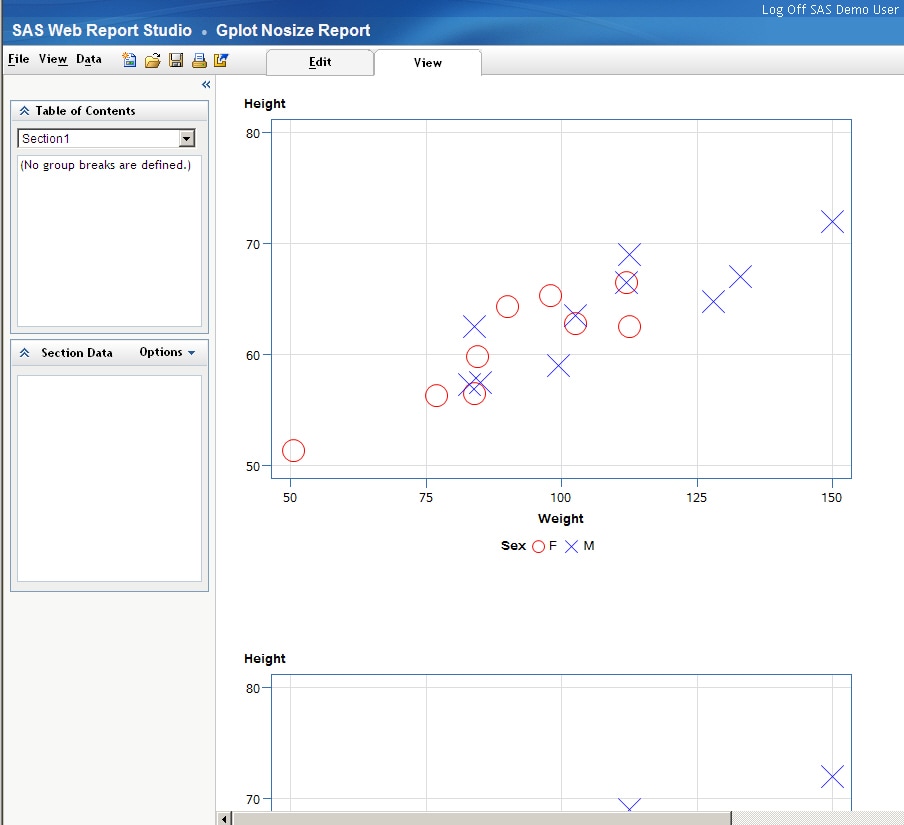
At this point, if you select File ►Print ► Print to PDF, each graph will be printed on a separate page.
Modified output
This sample demonstrates how to modify the previous code in order to print all four graphs on the same 8.5 x 11 page. To accomplish this task, VSIZE= and HSIZE= options are added on a GOPTIONS statement. Assuming that the margins are set to one-inch on all four sides, the following code sets the values for VSIZE and HSIZE to 3 inches.
Note: You can adjust the margins.
*ProcessBody;
%stpbegin;

/* Add the GOPTIONS VSIZE and HSIZE */
goptions ftitle="albany amt/bold" ftext="albany amt" gunit=pct htitle=14pt htext=10pt vsize=3 in hsize= 3 in;

symbol1 value=circle height=5 interpol=none color=red;
symbol2 value=X      height=5 interpol=none color=blue;
axis1 order=(50 to 80 by 10) minor=none offset=(3,3);
axis2 order=(50 to 150 by 25) minor=none offset=(3,3);

proc gplot data=sashelp.class;
plot height*weight=sex /
 vaxis=axis1
 haxis=axis2
 autovref cvref=graydd
 autohref chref=graydd
 ;
run;
quit;
%stpend;
|
Note: The VSIZE and HSIZE values depend on how many graphs you want to print on one page. You might need to try several different settings in order to achieve the best results.
Here is how the modified output appears in SAS Web Report Studio.
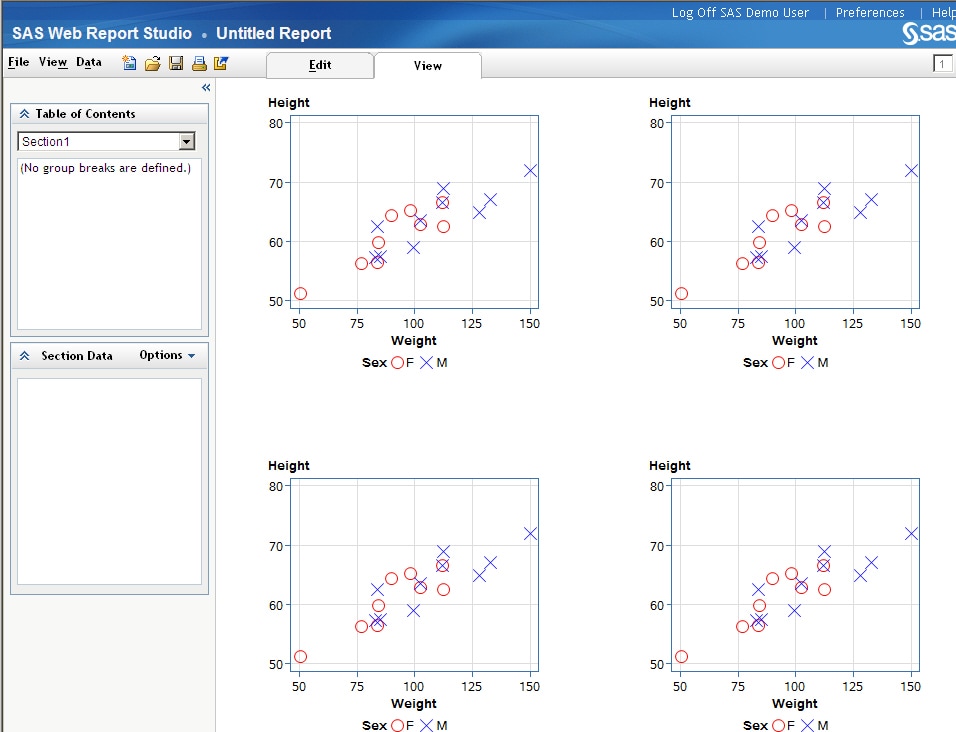
At this point, if you select File ►Print ► Print to PDF, each graph will be printed on a one 8.5 x 11 page. Select the Results tab for a link to sample PDF output.
Additional Documentation
For more information about the VSIZE= and HSIZE= options, see Graphics Options and Device Parameters Dictionary.
For more information about SAS Web Report Studio, see the SAS Web Report Studio documentation page.
These sample files and code examples are provided by SAS Institute Inc. "as is" without warranty of any kind, either express or implied, including but not limited to the implied warranties of merchantability and fitness for a particular purpose. Recipients acknowledge and agree that SAS Institute shall not be liable for any damages whatsoever arising out of their use of this material. In addition, SAS Institute will provide no support for the materials contained herein.
These sample files and code examples are provided by SAS Institute Inc. "as is" without warranty of any kind, either express or implied, including but not limited to the implied warranties of merchantability and fitness for a particular purpose. Recipients acknowledge and agree that SAS Institute shall not be liable for any damages whatsoever arising out of their use of this material. In addition, SAS Institute will provide no support for the materials contained herein.
| Type: | Sample |
| Date Modified: | 2010-10-19 14:06:36 |
| Date Created: | 2010-07-21 09:53:09 |
Operating System and Release Information
| Product Family | Product | Host | Product Release | SAS Release | ||
| Starting | Ending | Starting | Ending | |||
| SAS System | SAS Web Report Studio | Microsoft Windows 2000 Advanced Server | 3.1 | 9.1 TS1M3 SP4 | ||
| Microsoft Windows 2000 Datacenter Server | 3.1 | 9.1 TS1M3 SP4 | ||||
| Microsoft Windows 2000 Server | 3.1 | 9.1 TS1M3 SP4 | ||||
| Microsoft Windows 2000 Professional | 3.1 | 9.1 TS1M3 SP4 | ||||
| Microsoft Windows NT Workstation | 3.1 | 9.1 TS1M3 SP4 | ||||
| Microsoft Windows Server 2003 Datacenter Edition | 3.1 | 9.1 TS1M3 SP4 | ||||
| Microsoft Windows Server 2003 Enterprise Edition | 3.1 | 9.1 TS1M3 SP4 | ||||
| Microsoft Windows Server 2003 Standard Edition | 3.1 | 9.1 TS1M3 SP4 | ||||
| Microsoft Windows XP Professional | 3.1 | 9.1 TS1M3 SP4 | ||||
| Windows Vista | 3.1 | 9.1 TS1M3 SP4 | ||||
| Windows Vista for x64 | 3.1 | 9.1 TS1M3 SP4 | ||||
| 64-bit Enabled AIX | 3.1 | 9.1 TS1M3 SP4 | ||||
| 64-bit Enabled Solaris | 3.1 | 9.1 TS1M3 SP4 | ||||
| HP-UX IPF | 3.1 | 9.1 TS1M3 SP4 | ||||