Usage Note 37767: How can I produce a box plot with a logarithmically-scaled vertical axis?
 |  |  |
PROC BOXPLOT does not support nonlinear axis scaling, so it has no PLOT statement options for a log scale. Also, scaling options on an AXIS statement are ignored.
Beginning in SAS 9.2, you can generate a box plot with a log scale vertical axis in PROC SGPLOT.
Using PROC SGPLOT
The following data represent failure times of machine parts, some of which are manufactured by manufacturer A and some by manufacturer B.
   data A;
     input lifetime@@ ;
     mfg = 'A';
     datalines;
   620  470  260  89   388  242
   103  100  39   460  284  1285
   218  393  106  158  152  477
   403  103  69   158  818  947
   399  1274 32   12   134  660
   548  381  203  871  193  531
   317  85   1410 250  41   1101
   32   421  32   343  376  1512
   1792 47   95   76   515  72
   1585 253  6    860  89   1055
   537  101  385  176  11   565
   164  16   1267 352  160  195
   1279 356  751  500  803  560
   151  24   689  1119 1733 2194
   763  555  14   45   776  1
   ;

   data B;
     input lifetime@@ ;
     mfg = 'B';
     datalines;
   1747 945  12   1453 14   150
   20   41   35   69   195  89
   1090 1868 294  96   618  44
   142  892  1307 310  230  30
   403  860  23   406  1054 1935
   561  348  130  13   230  250
   317  304  79   1793 536  12
   9    256  201  733  510  660
   122  27   273  1231 182  289
   667  761  1096 43   44   87
   405  998  1409 61   278  407
   113  25   940  28   848  41
   646  575  219  303  304  38
   195  1061 174  377  388  10
   246  323  198  234  39   308
   55   729  813  1216 1618 539
   6    1566 459  946  764  794
   35   181  147  116  141  19
   380  609  546
   ;

   data lifdat;
     set A B;
     run;
The following VBOX statement in PROC SGPLOT produces a vertical box plot using the default scaling.
   proc sgplot data=lifdat;
     vbox lifetime / category=mfg;
     run;

|
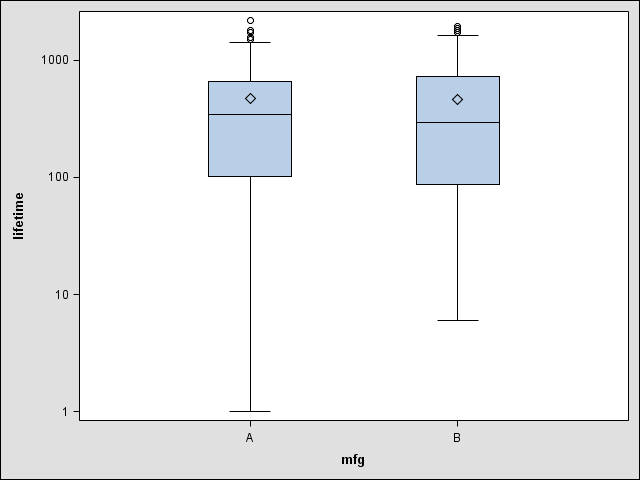
The YAXIS statement specifies options for the vertical axis. The TYPE=LOG option specifies a log scale axis. The LOGBASE= and LOGSTYLE= options allow for customization of the base value and formatting. The LOGBASE=10 option specifies that the log scale use base 10, and the LOGSTYLE=LOGEXPAND option places the tick marks at integer powers of 10.
   proc sgplot data=lifdat;
     vbox lifetime / category=mfg;
     yaxis type=log logbase=10 logstyle=logexpand;
     run;
|
Prior to SAS 9.2, PROC GPLOT can be used to generate a box plot with a log scale vertical axis. Additional programming is needed to get plots similar to the default output from PROC BOXPLOT.
Using PROC GPLOT
PROC GPLOT does not plot the group means, which is done by default in PROC BOXPLOT. Prior to plotting, compute the group means and combine them with the raw data. This will allow them to be overlaid on the box-and-whisker plots.
   proc means data=lifdat noprint;
     by mfg;
     var lifetime;
     output out=out mean=mean;
     run;
   data lifdat;
     merge lifdat out;
     by mfg;
     run;
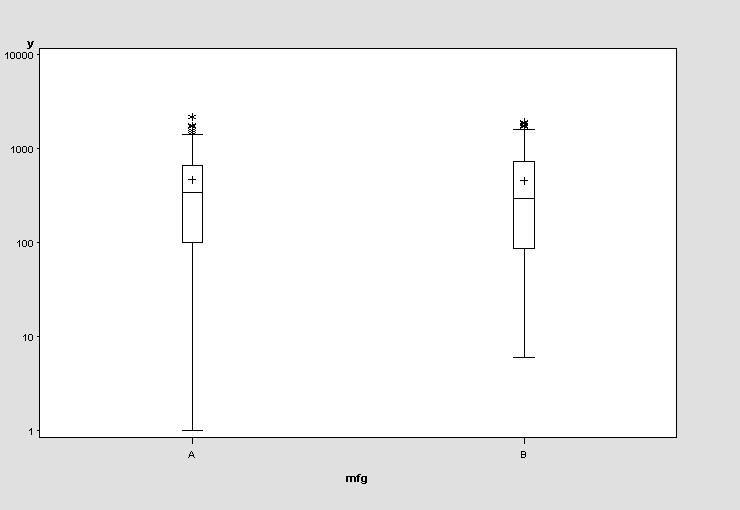
The I=BOXT option in the SYMBOL2 statement specifies a schematic box plot interpolation method for the second variable in the PLOT statement. The VAXIS= option points to the AXIS2 statement which contains the LOGBASE=10 option to scale the axis values logarithmically using base 10.
   symbol1 i=none v=plus c=black;
   symbol2 i=boxt bwidth=4 v=star c=black;
   axis1 minor=none offset=(30,30);
   axis2 minor=none label=('y') logbase=10;
   proc gplot data=lifdat;
     plot (mean lifetime)*mfg / overlay haxis=axis1 vaxis=axis2;
     run;
     quit;
|
Operating System and Release Information
| Product Family | Product | System | SAS Release | |
| Reported | Fixed* | |||
| SAS System | SAS/STAT | z/OS | ||
| OpenVMS VAX | ||||
| Microsoft® Windows® for 64-Bit Itanium-based Systems | ||||
| Microsoft Windows Server 2003 Datacenter 64-bit Edition | ||||
| Microsoft Windows Server 2003 Enterprise 64-bit Edition | ||||
| Microsoft Windows XP 64-bit Edition | ||||
| Microsoft® Windows® for x64 | ||||
| OS/2 | ||||
| Microsoft Windows 7 | ||||
| Microsoft Windows 95/98 | ||||
| Microsoft Windows 2000 Advanced Server | ||||
| Microsoft Windows 2000 Datacenter Server | ||||
| Microsoft Windows 2000 Server | ||||
| Microsoft Windows 2000 Professional | ||||
| Microsoft Windows NT Workstation | ||||
| Microsoft Windows Server 2003 Datacenter Edition | ||||
| Microsoft Windows Server 2003 Enterprise Edition | ||||
| Microsoft Windows Server 2003 Standard Edition | ||||
| Microsoft Windows Server 2008 | ||||
| Microsoft Windows XP Professional | ||||
| Windows Millennium Edition (Me) | ||||
| Windows Vista | ||||
| 64-bit Enabled AIX | ||||
| 64-bit Enabled HP-UX | ||||
| 64-bit Enabled Solaris | ||||
| ABI+ for Intel Architecture | ||||
| AIX | ||||
| HP-UX | ||||
| HP-UX IPF | ||||
| IRIX | ||||
| Linux | ||||
| Linux for x64 | ||||
| Linux on Itanium | ||||
| OpenVMS Alpha | ||||
| OpenVMS on HP Integrity | ||||
| Solaris | ||||
| Solaris for x64 | ||||
| Tru64 UNIX | ||||
| Type: | Usage Note |
| Priority: | |
| Topic: | Analytics ==> Descriptive Statistics Analytics ==> Distribution Analysis SAS Reference ==> Procedures ==> BOXPLOT SAS Reference ==> Procedures ==> GPLOT SAS Reference ==> Procedures ==> SGPLOT |
| Date Modified: | 2009-11-20 14:15:05 |
| Date Created: | 2009-11-09 14:47:02 |