Chapter Contents

Previous

Next
 Chapter Contents |
 Previous |
 Next |
| SAS/C C++ Development System User's Guide, Release 6.50 |
This section provides an example of running the debugger with a C++ program. Some of the features the example illustrates include
new
and
delete
operators.)
Note: This example requires you to allocate the DDname DBGSLIB to the
location of your standard header files. See SAS/C Compiler and Library
User's Guide for more information on the DBGSLIB DDname. ![[cautend]](../common/images/cautend.gif)
Here is the source code for the example. The program declares
class X
, which includes one data object, two constructors, one member function,
and a destructor. The member function multiplies the data object by 2. The
destructor checks the value of the data object and prints an error message
if the data object is not between 7 and 10. The
main
function uses the constructors to create several instances of class X, calls
the member function four times (once for each instance of
class X
), and
then deletes the instances of
class X
.
#include <iostream.h>
class X
{
public: int i;
      // first X constructor
   X(int ia)
   {
      i = ia;
   };
      // second X constructor
   X(int ib, int jb)
   {
      i = ib + jb;
   };
       // X member function myfunc()
   void myfunc()
   {
      i *= 2;
   };
      // X destructor
   ~X()
   {
      int id;
      id = i / 2;
      if (id < 7 || id > 10)
      printf("Error - Out of range\n");
   };
};
int main()
{
   X *x1 = new X(7);
   X *x2 = new X(6,2);
   X *x3 = new X(9);
   X *x4 = new X(9,1);
   x1->myfunc();
   x2->myfunc();
   x3->myfunc();
   x4->myfunc();
   delete x1;
   delete x2;
   delete x3;
   delete x4;
   return 0;
}
|
break, go, query, drop
, and
on
debugger commands to complete the program.
The numbered steps tell you what to type in and show the results of your commands
in the various debugger windows.
You first need to translate, link, and run the sample program. Be sure
to specify the
debug
option when you translate. For information on translating, linking,
and running a program in your environment (TSO or CMS), see Using the SAS/C C++ Development System under TSO, CMS, MVS Batch, and OpenEdition . For information on setting
up your files and invoking the debugger, see the SAS/C Debugger User's
Guide and Reference, Third Edition and the SAS/C Compiler and
Library User's Guide. Initial Appearance of the SAS/C Debugger
shows the appearance of the debugger at the beginning of your debugging session.
Initial Appearance of the SAS/C Debugger

Enter the following debugger
commands in sequence. Debugger commands
are entered after the
Cdebug:
prompt located in the Command window at the bottom of the screen. (In the
following discussion, debugger commands are shown in
monospace
font.)
break "X::X"(0) entry
This command sets breakpoints at entry to all constructors for
X
. The subscript of 0 is necessary because the constructors are overloaded
functions. Because the function name has a multitoken name, double quotes
are necessary.
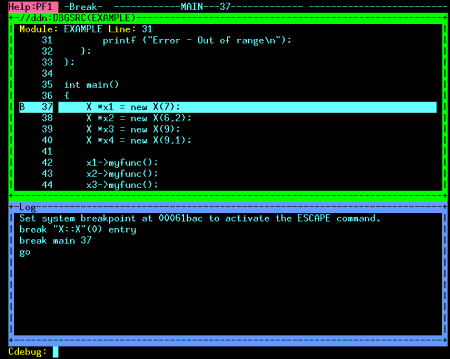
break main 37
These two commands first set a breakpoint at line 37 of the
main
function
and tell the debugger to advance to the first breakpoint. The debugger stops
on line 37 of
main
, as shown in the illustration of the Source window in Stopping at Main .

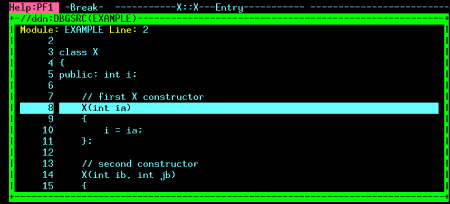
go
The program proceeds until it enters the first constructor. Stopping in a Constructor shows the Source window.

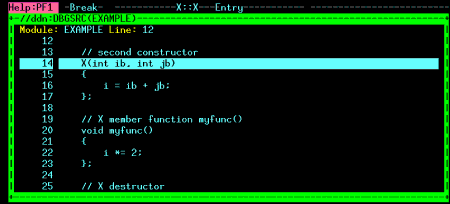
go
Yet another
go
causes
the debugger to stop at entry to the next constructor, as shown in Stopping in Another Constructor .
Stopping in Another Constructor

query
This command requests the Log window to show all actions and monitors in effect. Two breakpoints are shown; of special interest is the first breakpoint, which shows the subscript of 0, indicating a breakpoint is in effect for all instances of the overloaded constructor, X. Querying the Log Window shows the Log window.

drop 1
The
drop
command
drops breakpoint #1 (it is no longer necessary). Next, you set breakpoints
on the return of both versions of the overloaded constructor, using the subscripts
1 and 2. The two
on
commands
tell the debugger to print the value of the
X
member function
i
on the entry
to and return from the
myfunc
member function. The next command sets a
breakpoint on the return of the destructor (
b
is an abbreviation for
break
). Finally, the
query
command shows all the actions and monitors in effect. Of special
interest
are breakpoints #3 and #4. These breakpoints show the prototypes for the first
and second constructors (the first takes a single
int
; the second takes two
int
s). Another Log Window shows
the Log window after this series of commands.

go
This
go
command causes
the debugger to proceed until it reaches the return from the second constructor.
go
Another
go
causes
the debugger to proceed until it reaches the return from the first constructor.
go
This
go
command causes
the debugger to stop again at return from the second constructor.
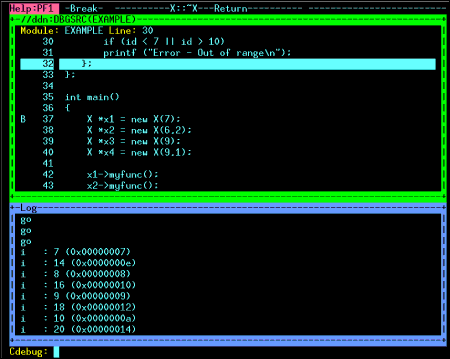
After this
go
command,
the Log window shows the output from eight print commands (4 from entry to
myfunc
and 4 from return from
myfunc
). The values printed are 7,
14, 8, 16, 9, 18, 10, and 20. Notice also that the debugger stops at return
from the destructor. Log Window Showing Results from Print Commands
shows the Log and Source windows for this step.
Log Window Showing Results from Print Commands

go
At each of these
go
commands, the debugger stops at the return from the destructor.
break "X::Y" entry
This command illustrates the warning message issued by the debugger
when it cannot find a function in the debugger's list of visible functions.
Because
X::Y
is not a valid function name for this program, a warning message
appears in the Log window, as shown in Warning Message Displayed when the Debugger Can't Find a Function Name .
Warning Message Displayed when the Debugger Can't Find a Function Name

See Functions in a Mix of C and C++ Code for more information on when you may see this warning message.
go
With this last
go
command, execution completes, and the debugger terminates.
 Chapter Contents |
 Previous |
 Next |
 Top of Page |
Copyright © Tue Feb 10 12:11:23 EST 1998 by SAS Institute Inc., Cary, NC, USA. All rights reserved.