Insert a Graph into a Report
To insert a graph into a report in the SAS Web OLAP Viewer:
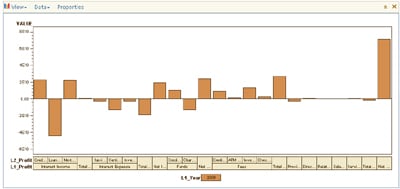
- Select a graph icon from the toolbar.

The graph is inserted into the report.
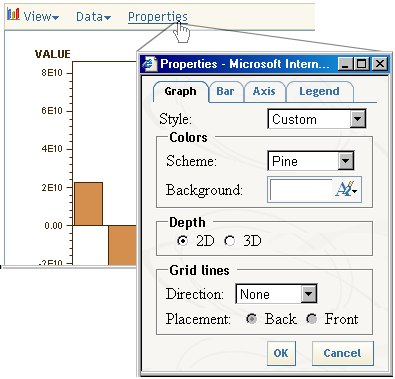
- To change the formatting of the graph, click Properties.
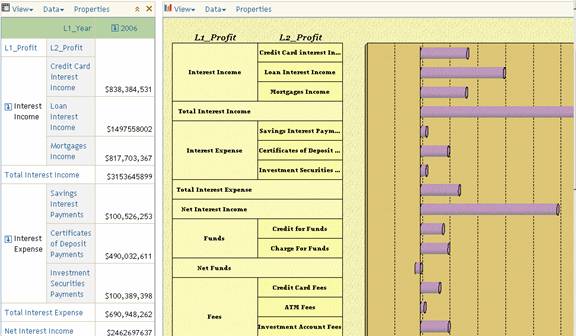
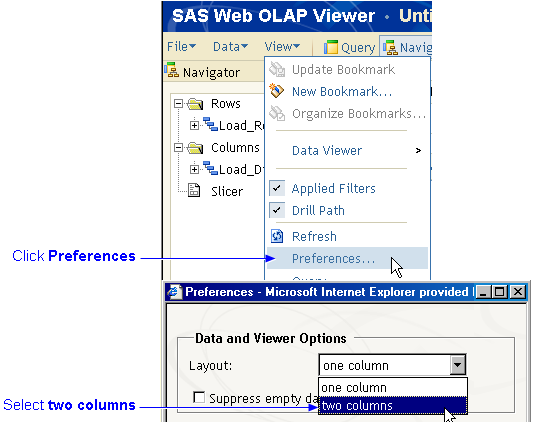
- You can display the table and graph next to each other by selecting View
 Preferences and selecting two columns for the layout.
The following picture shows the table and graph.