The IMLPlus program for this example is in the file Example4-StackedLine.sx in the directory <IMLStudio>\Programs\Samples\Annotation Examples, where <IMLStudio> is the directory in which you installed IML Studio.
This example modifies a line plot to fill in the areas below the lines. This example is taken from SAS/GRAPH Software: Examples, Version 6, First Edition.
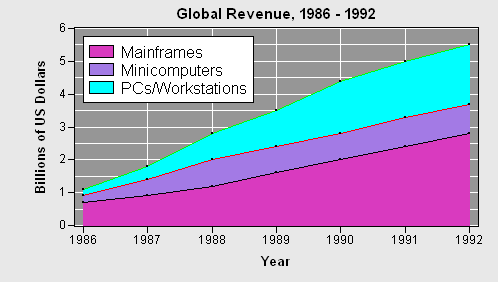
The program begins by defining the data. The data consists of revenue by year for three sources. This data is put into a DataObject and displayed by using a line plot.
The program modifies the view for the Y axis of the line plot so it shows the zero reference tick. It then displays a title, changes the background color, and eliminates the top and bottom margins of the Plot Area.
So that the lines and markers showing the data remain on top of the annotations, the program sets the drawing region to be the Plot Area background. It then draws a reference grid.
The DrawPolygon method is used to fill in the areas under the lines. For each line, the program defines a polygon that fills the area under the line. The polygon is defined by the ordered pairs of the line, followed by the ordered pairs (1991,0) and (1987,0). Each line is drawn in a different color. Note that the polygon for the highest line is drawn first and the polygon for the lowest line is drawn last. This ensures that the taller polygons do not obscure the shorter polygons.
Lastly, the program calls the DrawLegend module to place a legend in the upper-left corner of the Plot Area.