Create a SAS Report and Add Results
Select
File
New
Report
.
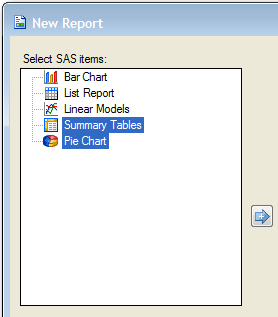
In the
Select SAS items
list, select
Pie Chart
, and then press
CTRL
and select
Summary Tables
.
Click to view the full window.
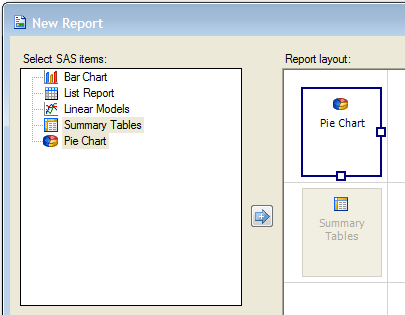
Click the
Add
button
.
If the pie chart is not above the summary tables in the
Report Layout
area, then drag the pie chart onto the summary tables item.
Click to view the full window.
Click
OK
and view the report. Scroll down to see the summary table below the pie chart.
Next you modify the report to add a header at the top of the page.