logo Getting Started with SAS Enterprise Guide Main menubacknext
    

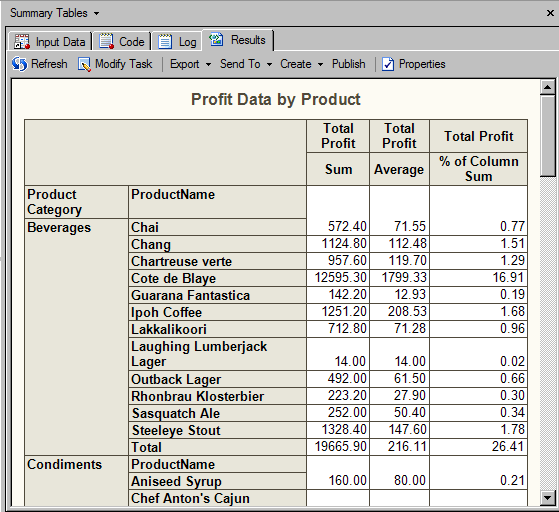
Run the Report and View the Results

You have specified the necessary options for the Summary Table report. Now you run the task and view the results.

  1. Click Finish.

  2. Scroll through the report and notice that you have totals for each product category and a grand total at the bottom of the report.

Summary Table Report
Click to view the full window.


  1. Close the Summary Tables task.


End of Lesson

You've finished In the next topic you create a pie chart that shows the percentage that each product category contributed to the overall profit for the company.

Main menubacknext