Reviewing a Profile Report
Overview
You can use the Report tab to review the profile report that you prepared on the Properties tab. Perform the following tasks:
- Review Table Metrics and Visualizations
- Review Custom Metrics
- Review Business Rules
- Review Alerts
- Review Field Metrics
![]() Note: You can select a specific version of the profile report from the drop-down menu in the Report tab toolbar.
Note: You can select a specific version of the profile report from the drop-down menu in the Report tab toolbar.
See also the performance tips and usage notes for Jobs, Profiles, Data Explorations.
Review Table Metrics and Visualizations
You can review table metrics on the Tables riser. Perform the following steps:
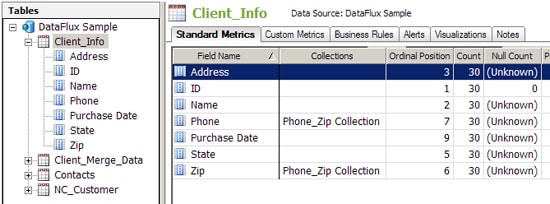
- Open a data connection in the Tables tree and click the name of a table.
- Review the metrics for the tables and the fields that it contains in the Standard Metrics tab, as shown in the following display:
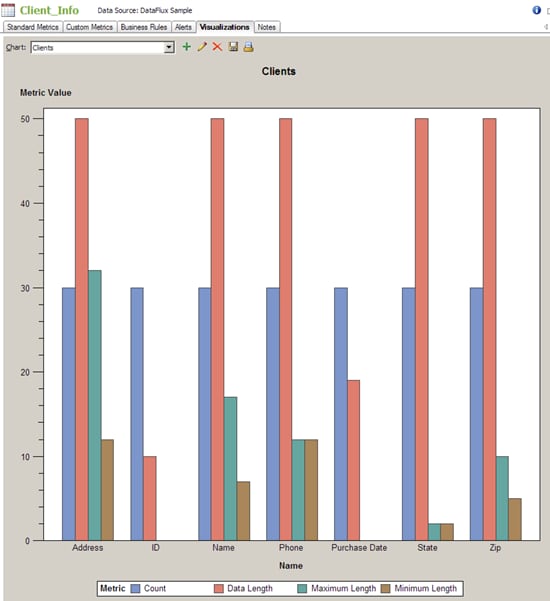
- Click Visualizations to review any visualizations that you have created for the selected table. A sample visualization is shown in the following display:
-
Note that you can use the toolbar above the chart to perform tasks that include selecting an existing chart, adding a new chart, editing the parameters for a chart, deleting a chart, saving a chart, and printing a chart.
![]() Note: You can also right-click in the results displayed in the Frequency Distribution tab and the Pattern Frequency Distribution tab and click Visualize in the pop-up menu. Then, you can build an appropriate visualization for the tab and navigate to it.
Note: You can also right-click in the results displayed in the Frequency Distribution tab and the Pattern Frequency Distribution tab and click Visualize in the pop-up menu. Then, you can build an appropriate visualization for the tab and navigate to it.
Review Custom Metrics
You can review the output of the custom metrics that you configured for the profile report. Perform the following steps:
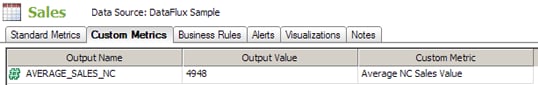
- Click the Custom Metrics tab. Summary information about the custom metric that you added to the profile report in the Properties tab is listed on the tab, as shown in the following display:
-
Note that the descriptive name for the metric is displayed in the Custom Metric column and the output value is shown in the Output Value column.
Review Business Rules
You can review the output of the business rules that you configured for the profile report. Perform the following steps:
- Click the Business Rules tab. Summary information about the business rule that you added to the profile report in the Properties tab is listed on the tab, as shown in the following display:
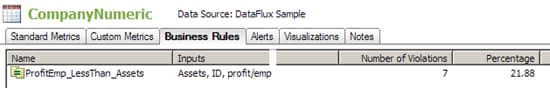
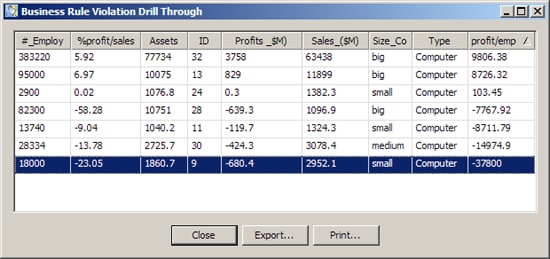
- Double-click the business rule in the list to see a drill-through summary of the violations to the rule, as shown in the following display:
Review Alerts
You can review the output of the alerts that you configured for the profile report by clicking the Alerts tab. Summary information about the alert that you added to the profile report in the Properties tab is listed on the tab, as shown in the following display:
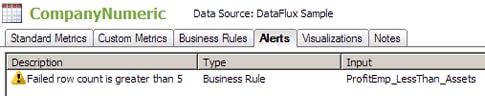
The alert is only displayed when the alert conditions are satisfied and the alert is triggered. The icon attached to the alert summary is also displayed on the table name and the field name for the alert in the Tables tree. If the alert is not triggered, none of these indicators are displayed. You can also click Alert Summary in the toolbar for the Report tab to see a summary of all the alerts that have been triggered when the profile report was run.
Review Field Metrics
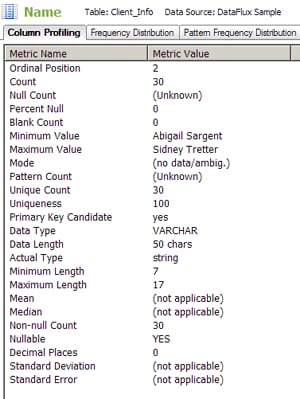
When you click a field in a table that is opened in the Tables tree, you display the Columns Profiling tab for the field, as shown in the following display:
 ::
::
You can also display field results in the other tabs provided when you click the field, provided that you have applied the metrics that support them.
![]() Note: You can also review metrics from the Collections riser in a profile report. Summarized metrics for a collection are shown when you click its name, and field metrics are shown when you select a field.
Note: You can also review metrics from the Collections riser in a profile report. Summarized metrics for a collection are shown when you click its name, and field metrics are shown when you select a field.