Performing Pattern Frequency Distribution Analysis
Overview
You can review the pattern frequency distribution of the values that are contained in a field. You can use this information to identify the variety of data patterns used for similar data. Then, you can decide which patterns to use.
Prepare and run a pattern frequency distribution analysis in the Properties tab for a profile report. Then, you can review the results in the Report tab. Perform the following tasks in an existing profile:
- Prepare and Run a Pattern Frequency Distribution Analysis
- Review the Results of a Pattern Frequency Distribution Analysis
Prepare and Run a Pattern Frequency Distribution Analysis
You can prepare and run a pattern frequency distribution analysis in the Properties tab. Perform the following steps:
- Verify that the default metrics for the current profile include pattern frequency distribution analysis. Note that you can also set options for pattern frequency analysis in the Options dialog that you can access from the Tools menu in the Properties tab. The options on the General tab of the dialog control how many rows are sampled for pattern distribution and whether leading or trailing spaces are trimmed. The options on the Quality Knowledge Base tab enable you to select a locale and a data quality pattern analysis.
- Click OK to save your settings.
- Click Run to run the profile.
Review the Results of a Pattern Frequency Distribution Analysis
You can review the results of a pattern frequency distribution analysis in the Report tab of a profile report. Perform the following steps:
- Open the table that contains a field that is enabled for pattern frequency distribution analysis.
- Click the field. The analysis for a sample field is shown in the following display:

By default the Pattern Frequency Distribution tab is optimized for Latin-1 data. It uses the following rules to represent the pattern of characters in the data:
- The digits 0 to 9 are represented by the number 9.
- The lower-case letters a to z are represented by the lower-case letter a.
- The upper-case letters A to Z are represented by capital letter A.
- The digits in parentheses, such as Aa(7), show the number of characters in a data item.
For example, the pattern A.A. Aaa 9999 corresponds to the following address in the data: P.O. Box 6239. You can double-click a row in the Pattern Frequency Distribution tab to see the underlying data. Of course, you can click the Frequency Distribution tab to see the frequency distribution for all of the data, as shown in the following display:
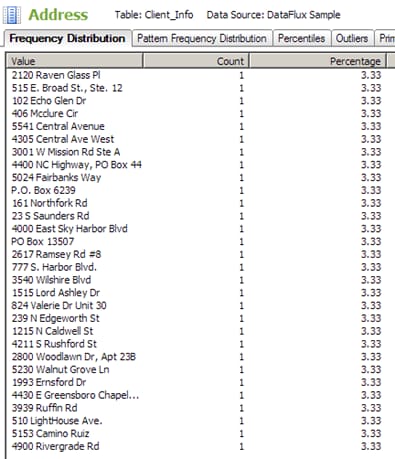
To generate a visualization, right-click anywhere in the Frequency Distribution tab or Pattern Frequency Distribution tab and select Visualize.