Overview of the Folders Riser Bar
The Navigation Tree and Information Pane
As described in the main Folders Riser Bar topic, you can use the Folders riser bar to work with jobs, profiles, and other objects in DataFlux Data Management Studio.
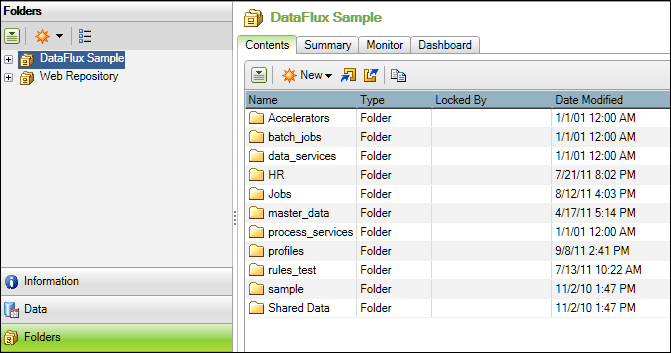
The navigation tree on the left enables you to select various kinds of items. The information pane on the right displays information about the selected item. In the previous figure, the SAS Sample repository is selected, and the custom folders in that repository are listed on the right. Some items, such as repositories, have additional tabs on the right that enable you to perform special tasks that kind of item (such as the Summary, Monitor and Dashboard tabs).
The Folders riser bar includes the following basic controls which can appear on the left and the right. As you expand the repository folders and select different items in the tree, additional controls will appear for some items.
| Icon | Name | Description |
|---|---|---|
|
|
Action menu | Performs an action on a selected item. The available actions vary depending on the item. Available actions might include import, export, copy, delete, rename, and move to folder. |
|
|
New object menu. | Create a new item such as a business rule, a profile, a data job, etc. You will specify the repository and custom folder where the new item should be stored. |

|
Group Items by Type button. | If the Group Items by Type button is selected, the tree organizes items in system-defined folders, as described in Group Items by Type. If this button is not selected, the tree organizes items in custom folders, as described in Custom Folders View. |
Group Items by Type
If you click the Group Items by Type button above the navigation tree, the tree organizes items in system-defined folders, as shown in the next figure.
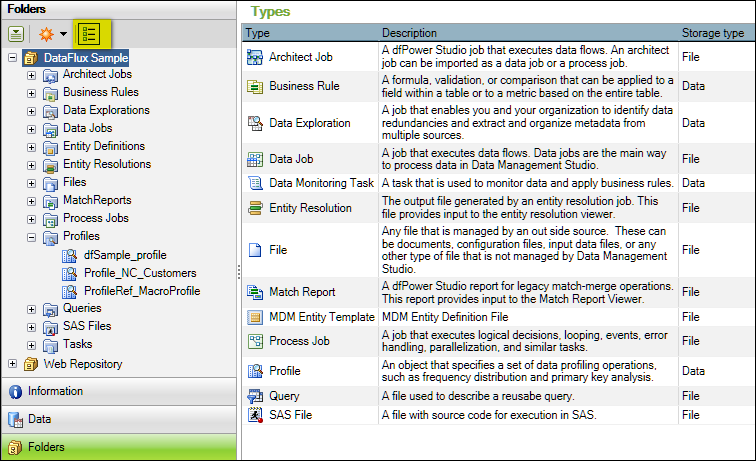
In the previous figure, the Group Items by Type button above the navigation tree has been clicked; the folder for the SAS Sample repository is selected and expanded; and the system-defined folders for various kinds of items in the current repository are shown in the tree on the left. When the repository is selected as shown above, a description of the types of items that can be in each repository appears on the right. For more information about the main kinds of items that appear in the Group Items by Type view, see the main Folders Riser Bar topic.
In the previous figure, the expanded system folder named Profiles contains three profiles: dfSample_profile, Profile_NC_Customers, and ProfileRef_MacroProfile. In the Group Items by Type view, each folder contains all of the objects of a particular type that are contained in the selected repository.
Custom Folders View
If the Group Items by Type button is not active, the tree organizes items by custom folders, as shown in the next figure.
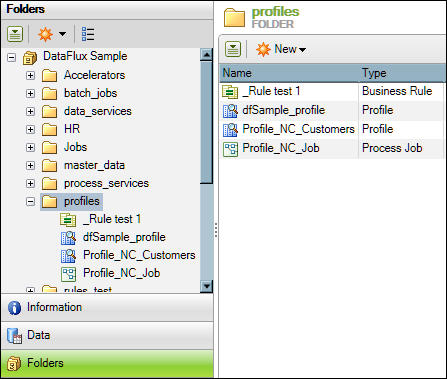
In the previous figure, the folder for the SAS Sample repository is expanded and the custom folders for various items in the current repository are shown in the tree on the left. The expanded custom folder named profiles contains four items: a business rule named _Rule_test1; two profiles named dfSample_profile and Profile_NC_Customers; and a process job named Profile_NC_Job. The figure illustrates one advantage of custom folders: they can contain different types of items that share a relationship that is determined by your site. When you add new items, you can specify the appropriate custom folder for that item.
As shown above, when a custom folder such as profiles is selected, a list of the items that are contained in that folder appears on the right, along with a set of relevant controls. The next figure illustrates the view when a specific item is selected in the navigation tree.
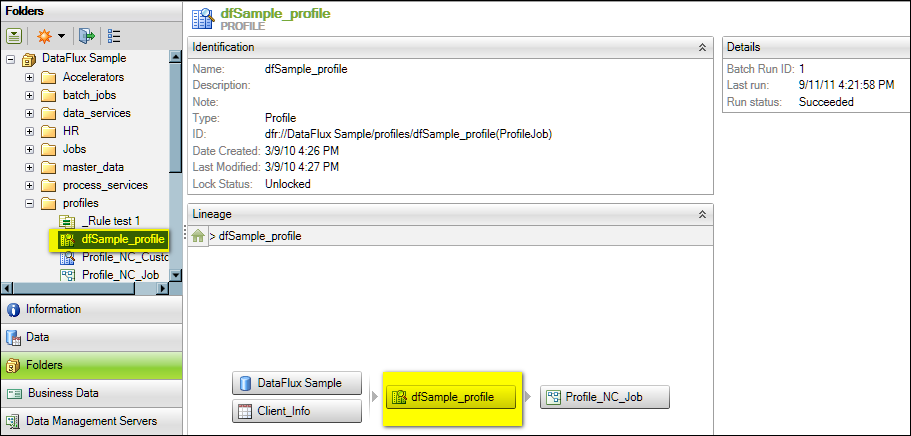
In the previous figure, the profile named dfSample_profile is selected, and the right panel displays various kinds of information about this profile. The information that is displayed for a selected item varies with the kind of item. For example, in the case of the selected profile (dfSample_profile), you can see the following:
- Identification - general information about the profile, such as when it was created and updated.
- Details - Information about the last run of the profile.
- Lineage - A flow diagram that shows the inputs to the profile (SAS Sample connection, Client_Info table) and the items that receive output from the profile (the process job Profile_NC_Job).
If you select the icon for a repository, a set of tabs will display on the right, including the Dashboard tab, as shown in the next figure. For information about updating lineages, see Updating Lineages.
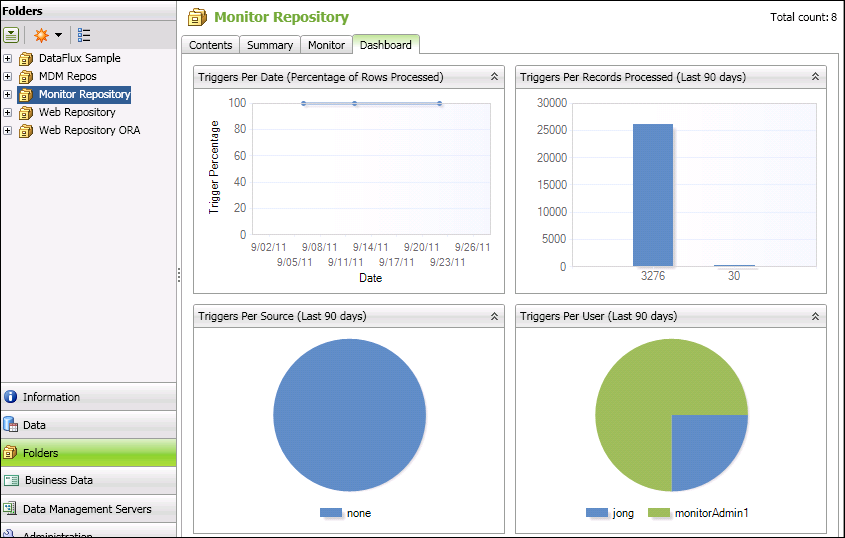
The Dashboard and Monitor tabs display the exceptions to monitored rules. For example, you can create a business rule that tracks the profit per employee against assets over time. Then, you link the business rule to a task. When you add the task to a monitoring job and run the job, you trigger input to the Monitor and Dashboard viewers in DataFlux Data Management Studio. For more information about data monitoring, see Monitoring Data.