Creating Dashboards, Dimensions, and Thresholds
Overview
A dashboard is a group that is created in the Business Rules Manager in DataFlux Data Management Studio. It is used to group a set of dimensions and their rules into a subject area. For example, in DataFlux Data Management Studio, you might create a dashboard called Fiscal Dashboard to monitor financial data. One of its dimensions might be Profit, which contains a set of rules that measure profit. These rules would be associated with a task that specifies an action to be taken when an exception to the rule is encountered. This task and the Fiscal Dashboard could be selected in the Data Monitoring node in a DataFlux Data Management Studio data job. When the job is run, the selected task is executed and the exceptions are associated with the selected dashboard (Fiscal Dashboard).
You can see the values for dashboards and dimensions in the Triggered rules table in the Monitor Viewer in DataFlux Data Management Studio. If you want to display this information outside of DataFlux Data Management Studio, see SAS Visual Analytics Report Used to Monitor Data Quality.
Considered from the opposite direction, several related rules are grouped into a dimension. The number of exceptions against these rules is fed into a calculation that generates a dimension score. Exceptions to the rules contained in the dimension are calculated into dimension and dashboard scores. This information can also be seen in SAS Visual Analytics Report Used to Monitor Data Quality.
Thresholds enable you to customize the speedometer display that illustrates the relationships between dashboards, dimensions, and rules. You set the thresholds in the same Business Rules Manager that you use to create the dashboards and the dimensions.
Perform the following tasks to create these objects:
Create Dashboards
You should create a new dashboard whenever you need to focus on your data in a specific way that you define by grouping related dimensions and rules. For example, a Fiscal Dashboard could group dimensions such as accuracy, consistency, and structure and the rules that support them. Perform the following steps:
- Open the Business Rule Manager.
- Right-click the Dashboards folder and click New Dashboard.
- Enter a name and a description in the appropriate fields.
- Select appropriate default intervals and default counts.
- Select an existing dashboard threshold or create a new threshold.
- Review the existing dimensions, dimension weights, and dimension thresholds. If you need to add a new dimension, see Create Dimensions.
- Select each dimension that you need to edit and click Dimension Details. Make any needed changes to the dimension weight or threshold.
- If you do not need a dimension for the new dashboard, assign it a weight of 0.00. Click OK to save the changes.
- Click OK to save the new dimension and display in the Business Rules Manager. Note that you can right-click any existing dashboard to Edit, Duplicate, or Delete it.
Once created, the dashboards collect data that rolls up from the dimensions and rule that they contain. Similarly, you can drill down from the dashboards to the dimensions and rules. The following display shows the New Dashboard dialog used to create the Fiscal Dashboard:

Add Dimensions
You can use the dimensions that you include in a dashboard to manage its scope. Dimensions such as accuracy and consistency contain specialized rules. When these rules generate exceptions in monitoring jobs, you can see the results clearly reflected in the Triggered rules table in the Monitor Viewer and Dashboard Viewer in DataFlux Data Management Studio. Perform the following steps to add dimensions:
- Open the Business Rule Manager.
- Right-click the Dimensions folder and click New Dimension.
- Enter a name and a description in the appropriate fields.
- Click OK to save the new dimension. The dimension is added to the list of dimensions with a weight of 1.00. It inherits the default threshold for each dashboard. You can click Dimension Details within a Dashboard Properties dialog to edit the weight and threshold of a dimension in the context of a dashboard. This dialog is displayed when you edit a dashboard by right-clicking it in the Dashboards folder and clicking the Edit menu option. Such a dimension modification is shown in the following display:

- Click OK twice to save the changes to the dimension and the dashboard.
Create Thresholds
You can set threshold values to change the image displayed in the speedometer in the Dashboard Viewer to be more meaningful to you. Thresholds are applied to dimensions, which are rolled up into dashboards. Perform the following steps:
- Open the Business Rule Manager.
- Right-click the Threshold Definitions folder and click New Threshold.
- Enter a name and a description in the appropriate fields.
- Click Add to add the first threshold level.
- Enter a level name for the level.
- Select a color for the level.
- Set lower and upper bounds for the level.
- Click OK to save the level. The first level for the stability threshold definition is shown in the following display:
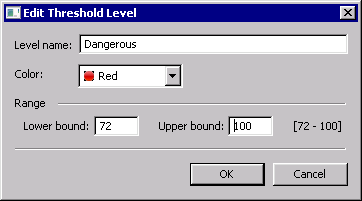
Note that the bounds between adjacent levels must overlap. For example, because the lower limit of this level is 72, the upper limit of the level below it must be at least 72.
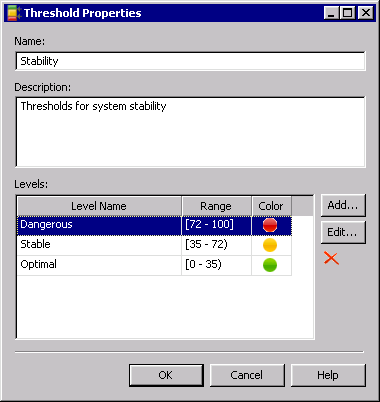
- Repeat this process for the remaining levels. The completed definition for the stability threshold is shown in the following display:
You can see the effects of thresholds by applying the threshold definition to a dashboard and its dimensions. Use the drop-down menu in the Dashboard threshold field in the Dashboard Properties dialog to select a new threshold definition for a dashboard. The following display shows the Fiscal Dashboard with the default threshold definition:
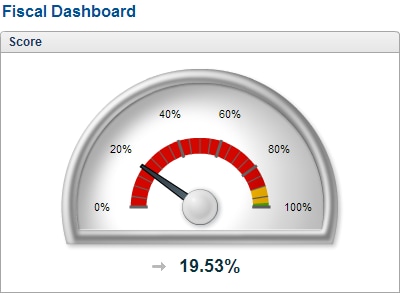
This display shows the Fiscal Dashboard with the stability threshold definition:
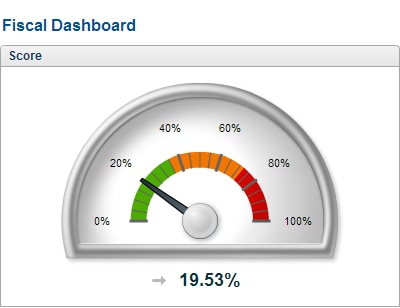
Note that the scores are unchanged. Only the color ranges are different.
Change the threshold definition for a dimension by selecting the dimension in the Dimension thresholds table in the Dashboard Properties dialog and clicking Dimension Details. You can use the Dimension Details dialog to change the weight and threshold for the selected dimension. Changing a dimension threshold changes the speedometer that is displayed when you drill down to that dimension. You should always set dashboards and the dimensions that they contain to the same threshold definitions in order to ensure that their speedometer displays show the same colors in the same ranges.