
DataFlux Data Management Studio 2.6: User Guide
You can use the Summary tab to display an overview of a table that is selected in the Data tree. This will provide an overview of how a table is identified, what it contains, and how it is used.
From the desktop, click the Data Connections riser bar. Then, open a connection and select a table. Finally, click the Summary tab on the right.
The Identification section displays the name and type of the selected table. The Details section displays the field and row counts for the selected table. The Lineage section displays a menu path and a graphic representation of how the table is used. For example, the following display shows the initial lineage displayed for the Client_Info table:
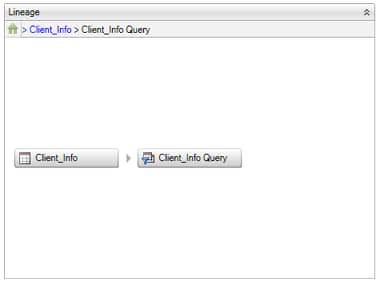
Note that the path to the table is displayed at the top of the Lineage section and the objects that consume the table's data are displayed below it. If you click one of the objects, the path and the graphic change to reflect the relationship between the table and the selected object, as shown in following display:
Note that you can enable and disable the lineage display with the Enable Lineage option in the General section of the Data Management Studio Options dialog. You can access this dialog from the Tools menu. For information about updating lineages, see Updating Lineages.
|
Documentation Feedback: yourturn@sas.com
|
Doc ID: dfU_T_TableExam_Sum.html |