SAS® AppDev Studio™ 3.0 Developer's Site
| Scatter Plot |
|
|
This example shows you how to create a basic Scatter Plot component for display in a JSP.
See It
How It Works
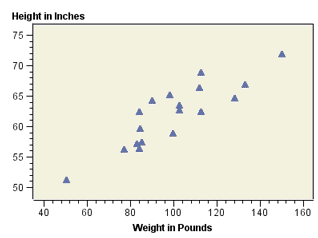
This example uses a <sas:ScatterPlot> custom tag structure to create a Scatter Plot and assign axis labels to the plot. For the data source, it uses servlet code to get a JDBC connection to SAS data, build a relational data model with a JDBCToTableModelAdapter, and then assign the adapter to a ScatterPlotTableDataModel.