What's New in the Output Delivery System

Overview

The following enhancements have been made to the Output Delivery System:
  • In SAS 9.3, defaults for output in the SAS windowing environment for Microsoft Windows and UNIX have changed.
  • The ODS Graphics Editor, the ODS Graphics Designer, and the ODS Graphics Procedures have moved from SAS/GRAPH to Base SAS.
  • The Printer, PDF, PS, and PCL default printer values can now be changed in the SAS Registry.
  • Enhancements have been made to the DOCUMENT procedure.
  • Enhancements have been made to the TEMPLATE procedure.
  • Enhancements have been made to the ODS statements.
  • There are three new system options.

Changes to Default Output in the SAS Windowing Environment for UNIX and Windows

HTML Output in the SAS Windowing Environment

In SAS 9.3, the default destination in the SAS windowing environment is HTML, and ODS Graphics is enabled by default. These new defaults have several advantages. Graphs are integrated with tables, and all output is displayed in the same HTML file using a new style. This new style, HTMLBlue an all-color style that is designed to integrate tables and modern statistical graphics.
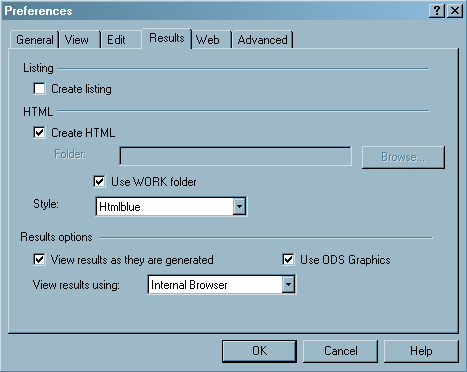
You can view and modify the default settings by selecting Toolsthen selectOptionsthen selectPreferences from the menu at the top of the main SAS window. Then open the Results tab. You can remember this sequence using the mnemonic TOPR (pronounced “topper”). The following display shows the SAS Results tab with the new default settings specified:
SAS Results Tab with the New Default Settings
The default settings in the Results tab are as follows:
  • The Create listing check box is not selected, so LISTING output is not created.
  • The Create HTML check box is selected, so HTML output is created.
  • The Use WORK folder check box is selected, so both HTML and graph image files are saved in the WORK folder (and not your current directory).
  • The default style, HTMLBlue, is selected from the Style drop-down list.
  • The Use ODS Graphics check box is selected, so ODS Graphics is enabled.
  • Internal browser is selected from the View results using: drop-down list, so results are viewed in the SAS Results Viewer.
In many cases, graphs are an integral part of a data analysis. However, when you run large computational programs (such as when you use procedures with many BY groups) you might not want to create graphs. In those cases, you should disable ODS Graphics, which will improve the performance of your program. You can disable and re-enable ODS Graphics in your SAS programs with the ODS GRAPHICS OFF and ODS GRAPHICS ON statements. You can also change the ODS Graphics default in the Results tab.

LISTING Output in the SAS Windowing Environment

Before SAS 9.3, SAS output in the SAS windowing environment was created by default in the LISTING destination. In the LISTING destination, tables are displayed in monospace, and graphs are not integrated with tables.
You can create LISTING output by selecting Toolsthen selectOptionsthen selectPreferences from the menu at the top of the main SAS window. Then open the Results tab. Select the Create listing check box, and if you do not want HTML output, then do not select the Create HTML check box.
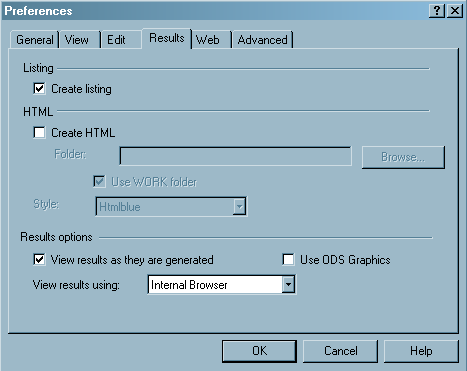
Before SAS 9.3, ODS Graphics was disabled by default. You can enable or disable ODS Graphics by default by using the check box in the Results tab, and you can use the ODS GRAPHICS ON and ODS GRAPHICS OFF statements to enable and disable ODS Graphics in your SAS programs. The following display shows the SAS Results tab with the old default settings specified:
SAS Results Tab with the Old Default Settings

Selected SAS/GRAPH Products Included with Base SAS Software

A SAS/GRAPH license is no longer required for ODS Graphics. The Graph Template Language (GTL), the ODS Graphics Procedures, the ODS Graphics Editor, and the ODS Graphics Designer are now all available with Base SAS software. The documentation for these products is now included in the Base SAS node in the SAS 9.3 Help and Documentation. For more information about these applications, refer to the following documentation:
  • SAS ODS Graphics: Procedures Guide
  • SAS Graph Template Language: User's Guide
  • SAS Graph Template Language: Reference
  • SAS ODS Graphics Designer: User's Guide
  • SAS ODS Graphics Editor: User's Guide

Changes to PRINTER Registry Settings

The Printer, PDF, PS, and PCL default printer values can now be changed in the SAS Registry.

DOCUMENT Procedure Enhancements

The following enhancements have been made to the DOCUMENT procedure:
SAS/GRAPH external graph titles are now included in an ODS Document.
The PRINT procedure is now fully supported by the DOCUMENT procedure.
The WHERE option for the REPLAY statements now has the following enhancements:
New subsetting variables have been added to the WHERE option for the REPLAY statement.
_MAX_
is the last observation.
_MIN_
is the first observation.
_OBS_
is the current observation number in an output object.
observation-number
is the observation number to be replayed.
observation-variable
is the name of an observation.
The WHERE option in the REPLAY statement now applies to output objects as well as directories.
The following options are new:
TEXTFILE= option
in the IMPORT TO statement imports a text file into an ODS document that can be replayed to open ODS destinations.
BYGROUPS option
in the LIST statement creates, in the entry list, columns for BY variables.
SHOW option
in the OBANOTE statement specifies that a table containing the output object’s after notes will be written to active destinations.
SHOW option
in the OBBNOTE statement specifies that a table containing the output object’s before notes will be written to active destinations.
SHOW option
in the OBFOOTN statement specifies that a table containing the output object’s footnotes will be written to active destinations.
SHOW option
in the OBSTITLE statement specifies that a table containing the output object’s subtitles will be written to active destinations.
SHOW option
in the OBTITLE statement specifies that a table containing the output object’s titles will be written to active destinations.

Template Procedure Enhancements

Table Template Enhancements

Default values for dynamic variables can now be supplied in the DYNAMIC, MVAR, and NMVAR statements for tabular output.

Style Template Enhancements

  • The following style attributes are new.
    BACKGROUNDPOSITION=position
    specifies the position of the background of the tables, cells, or graphs.
    BORDERCOLLAPSE= COLLAPSE | SEPARATE
    specifies whether the border is collapsed or separated.
    PADDING=dimension | dimension%
    specifies the amount of white space between the content of the cell and the border.
    PADDINGBOTTOM=dimension | dimension%
    specifies the amount of white space on the bottom of the content of the cell in the table.
    PADDINGLEFT=dimension | dimension%
    specifies the amount of white space on the left side of the content of the cell in the table.
    PADDINGRIGHT=dimension | dimension%
    specifies the amount of white space on the right side of the content of the cell in the table.
    PADDINGTOP=dimension | dimension%
    specifies the amount of white space on the top of the content of the cell in the table.
    WHITESPACE= NORMAL | NOWRAP | PRE | PRE_LINE | PRE_WRAP
    specifies how a line of text wraps.
  • You can now use RGBA (red green blue transparency) and CMYK (cyan magenta yellow black) colors with style attributes.

ODS Statements Enhancements

  • The HTML, PDF, PCL, and LISTING destinations now support Scalable Vector Graphics (SVG).
  • The PDF and PCL destinations now create Scalable Vector Graphics (SVG) by default.
  • The HTML destination now supports the BMP image type.
  • The ODS PRINTER statement now supports the GTITLE option and the GFOOTNOTE option.
  • The ODS TAGSETS.RTF statement has the following enhancements.
    • The following new event tagsets have been added to support measured tagset: TAGSETS.MEAS_EVENT_MAP, TAGSETS.MEAS_SHORT_MAP, and TAGSET.MEAS_TEXT_MAP.
    • OPTIONS (DOC=“changelog”) provides version control information for the measured tagset. When specified, information is printed to the SAS Log.
    • OPTIONS (TOC_LEVEL= ) allows the user to set the number of levels that appear in the table of contents.

New System Options

The following system options are new for ODS:
  • The new system option ODSDEST= restores the SAS version 9.2 output behavior in the SAS windowing environment.
  • The new system option ODSGRAPHICS= restores default 9.2 behavior in the Display Manager for ODS Graphics.
  • The new system option ODSSTYLE= restores the default 9.2 HTML style.