Describe Missing Data Task
About the Describe Missing Data Task
The Describe Missing Data task displays the frequencies and percentages of missing values for each selected variable. If two or more variables are assigned to this task, the
task displays the pattern of missing data across variables.
Example: Describing Missing Data for SASHELP.BASEBALL

Here is how to interpret
the results.
-
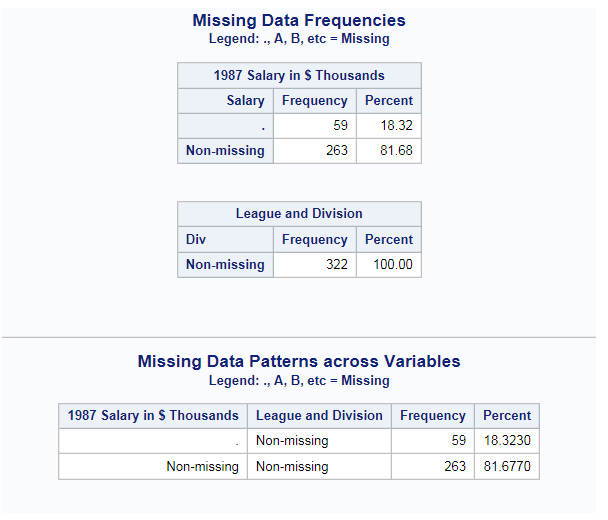
Under the Missing Data Frequencies heading, the first table shows 59 observations in the input data set have a missing value for the Salary variable. The second table shows that there are no missing values for the League and Division variable.
-
Under the Missing Data Patterns across Variables heading, the table shows the pattern of missing values across the variables. In this case, 59 observations have a missing value for the Salary variable. The League and Division variable contains no missing values. Therefore, the remaining 263 observations in the input data set do not have any missing values for the two variables.The legend for this table identifies special missing values in the input data. SAS enables you to differentiate among classes of missing values in numeric data. For numeric variables, you can designate up to 27 special missing values by using the letters A through Z, in either uppercase or lowercase, and the underscore character (_).For more information about special missing values, see SAS Language Reference: Concepts.
Setting the Data Options
To run the Describe
Missing Data task, you must assign at least one variable to the Analysis
variables role.
|
Role
|
Description
|
|---|---|
|
Roles
|
|
|
Analysis
variables
|
specifies the numeric and character variables to use in the analysis.
|
|
Additional Roles
|
|
|
Frequency
count
|
specifies that each observation in the table is assumed to represent n observations, where n is the value of the frequency count for that row.
|
|
Group analysis
by
|
computes separate statistics for each distinct value or combination of values of the Group analysis by variables.
|
Copyright © SAS Institute Inc. All rights reserved.