About SAS ODS Statistical Graphics
About SAS ODS Statistical Graphics
SAS ODS Statistical Graphics, more commonly referred to as SAS ODS Graphics, is an extension
of the SAS Output Delivery System (ODS). ODS manages all output that is created by
procedures and enables you to display the output in a variety of forms, including
HTML and PDF.
Many SAS analytical procedures use ODS Graphics functionality to produce graphs. ODS
Graphics uses the Graph Template Language
(GTL) syntax, which provides the power and flexibility to create many complex graphs.
The GTL is a comprehensive language for defining statistical graphics.
In SAS Studio, you can use the ODS Graphics Designer to define these statistical graphics
without knowing the GTL. After
a graph definition is created, you can use that graph definition to create an ODS
statistical graph in SAS Studio.
SAS ODS Graphics Designer
What Is the SAS ODS Graphics Designer?
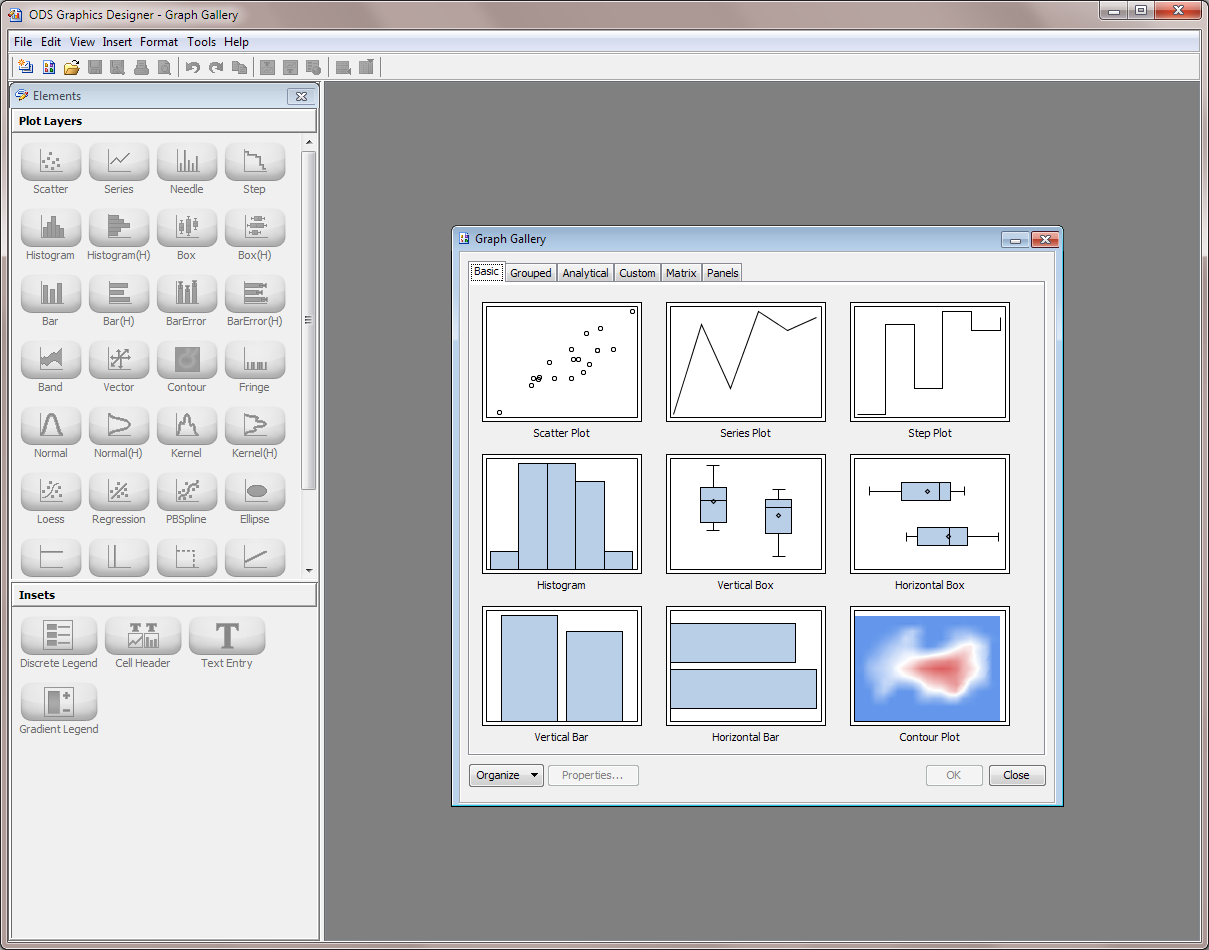
The SAS ODS Graphics Designer is an interactive graphical application that you can use to create and design custom graphs. The designer creates graphs
that are based on the Graph Template Language (GTL), which is the same language that
is used by SAS analytical procedures and SAS ODS Graphics procedures. The ODS Graphics
Designer provides a graphical user interface so that you can design graphs easily
without knowing the details of templates and the GTL.
Using point-and-click interaction, you can create simple or complex graphical views
of data for analysis. The ODS Graphics Designer enables you to design sophisticated
graphs by using a wide array
of plot types. You can design multi-cell graphs, classification panels, and scatter plot matrices. Your graphs can have titles, footnotes, legends, and other graphics elements. You
can save the results as an image for inclusion in a report or as an ODS Graphics Designer
file (SGD) that you can later edit.
For more information,
see SAS ODS Graphics Designer: User's Guide, which
is available from support.sas.com.
How to Install the SAS ODS Graphics Designer
If you have SAS Foundation installed on your machine, the SAS ODS Graphics Designer
is already available. For example, if you are using the single-user
edition of SAS Studio, the SAS ODS Graphics Designer is already installed because
you are running SAS Foundation and SAS Studio on the same machine.
Note: Only the Windows version
of the SAS ODS Graphics Designer is supported when you are running
SAS Studio. The SAS ODS Graphics Designer must be installed on the
same machine as the browser that you are using to access SAS Studio.
(SAS Studio might be installed on a different machine.) If multiple
users are accessing SAS Studio and these users are on different machines,
SAS ODS Graphics Designer must be installed on each user’s
machine.
To install the SAS
ODS Graphics Designer:
SAS ODS Graphics Editor
What Is the SAS ODS Graphics Editor?
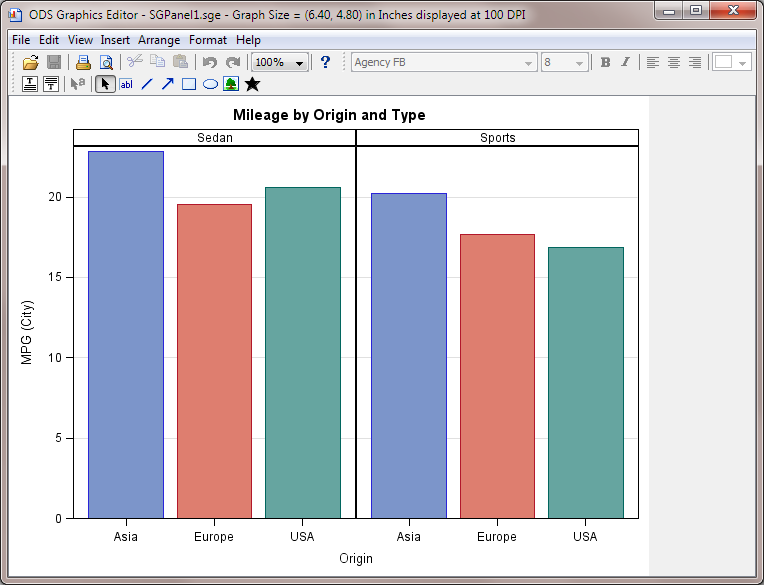
The ODS Graphics Editor enables you to edit the various elements in the output graph
while
keeping the underlying data unchanged. In addition, you can annotate a graph by inserting
text, lines, arrows, images, and other items in a layer above the graph. You can save
the results of your customization as an ODS Graphics Editor (SGE) file and make incremental
changes to the file. You can also save the results as a Portable Network Graphics
(PNG) image file for inclusion in other documents.
For more information about the SAS ODS Graphics Editor, see SAS ODS Graphics Editor: User's Guide, which is available from support.sas.com.
How to Edit Your Graphics Output
-
ods listing sge=on gpath="directory-path";
When you run this program, the graphical output is saved as an SGE file in the directory specified by the GPATH= option. -
In the Server Files and Folders section of the navigation pane, double-click the filename (with SGE extension) to open the graph in the SAS ODS Graphics Editor.
Copyright © SAS Institute Inc. All rights reserved.


