Two-Sample t Test Task
About the Two-Sample t Test Task
A two-sample t test
compares the mean of the first sample minus the mean of the second
sample to a given number, the null hypothesis difference.
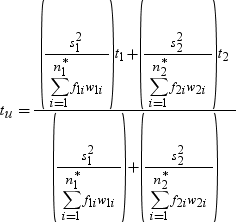
To compare means from
two independent samples with n1 and n2 observations
to a value m, use 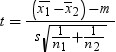 . In this example, s2 is
the pooled variance
. In this example, s2 is
the pooled variance 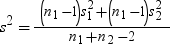 , and s21 and s22 are
the sample variances of the two groups. The use of this t statistic
depends on the assumption that
, and s21 and s22 are
the sample variances of the two groups. The use of this t statistic
depends on the assumption that  , where
  and
and  are the population variances of the two groups.
. In this example, s2 is
the pooled variance , and s21 and s22 are
the sample variances of the two groups. The use of this t statistic
depends on the assumption that , where and are the population variances of the two groups.

Setting Options

Copyright © SAS Institute Inc. All rights reserved.