Correlations Task

About the Correlations Task

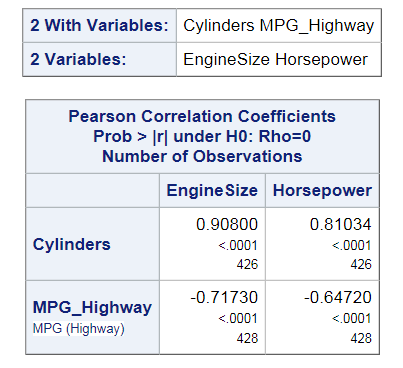
Correlation is a statistical procedure for describing the relationship between numeric variables. The relationship is described by calculating correlation coefficients for the variables. By default, the Correlations task calculates a Pearson product-moment correlation. This is a parametric measure of association for two continuous random variables. The correlations range from –1 to 1.

Example: Correlations in the Sashelp.Cars Data Set

To create this example:
  1. In the Tasks section, expand the Statistics folder and double-click Correlation. The user interface for the Correlations task opens.
  2. On the Data tab, select the SASHELP.CARS data set.
  3. Assign columns to these roles:
    Role
    Column
    Analysis variables
    EngineSize
    Horsepower
    Correlate with
    Cylinders
    MPG_Highway
  4. To run the task, click Submit SAS code.
Here are the results:
Numeric Results for the Correlations Task

Assigning Data to Roles

To run the Correlations task, you must assign at least two columns to the Analysis variables role, or you must assign at least one column to the Analysis variables role and one column to the Correlate with role.
Roles
Description
Roles
Analysis variables
lists the variables for which to compute correlation coefficients.
Correlate with
lists the variables with which the correlations of the analysis variables are to be computed.
Partial variables
removes the correlation of these variables from the analysis and correlates with variables before calculating the correlation.
Additional Roles
Frequency count
lists a numeric variable whose value represents the frequency of the observation. If you assign a variable to this role, the task assumes that each observation represents n observations, where n is the value of the frequency variable. If n is not an integer, SAS truncates it. If n is less than 1 or is missing, the observation is excluded from the analysis. The sum of the frequency variable represents the total number of observations.
Weight
lists the weights to use in the calculation of Pearson weighted product-moment correlation.
Group analysis by
enables you to obtain separate analyses of observations in groups that are defined by the BY variables.

Setting Options

Option Name
Description
Methods
Missing values
specifies how to treat observations with missing values. If you select the Use nonmissing values for all selected variables option, all observations with missing values are excluded from the analysis. If you select the Use nonmissing values for pairs of variables option, the correlation statistics are computed using the nonmissing pairs of variables.
Tables
By default, the results contain a table with the correlations and p-values. You can also include these statistics:
Correlations
Selecting this option includes the correlations in the results. You can also specify probabilities that are associated with each correlation coefficient and whether to order the correlations from highest to lowest in absolute value.
Covariances
Selecting this option includes the variance and covariance matrix in the results. Also, the Pearson correlations are displayed. If you assign a column to the Partial variables role, the task computes a partial covariance matrix.
Sum of squares and cross-products
Selecting this option displays a table of the sums of squares and cross products in the results. The Pearson correlations are also included in the results. If you assign a column to the Partial variables role, the unpartial sums of squares and cross-products matrix is displayed.
Corrected sum of squares and cross-products
Selecting this option displays a table of the corrected sums of squares and cross products. The Pearson correlations are also inclued in the results. If you assign a column to the Partial variables role, the task computes both an unpartial and a partial corrected sum of squares and cross-products matrix.
Descriptive statistics
Selecting this option includes the simple descriptive statistics for each variable. Even if you do not select this option and you choose to create an output data set, the data set contains the descriptive statistics for the variables.
Fisher’s z transformation
For a Pearson correlation, you can use the Fisher transformation options to request confidence limits and p-values under a specified alternative (null) hypothesis, h sub 0 , colon  rho   equals  , rho sub 0  , for correlation coefficients that use Fisher’s z transformation. If you select the Fisher’s z transformation check box, you must specify a value in the Alternative hypothesis box.
You can choose from these types of confidence limits:
  • Two-sided confidence limits requests two-sided confidence limits for the test of the null hypothesis, h sub 0 , colon  rho   equals  , rho sub 0  . This is the default.
  • Lower confidence limit requests a lower confidence limit for the test of the one-sided null hypothesis, h sub 0 , colon  rho    less than or equal to , rho sub 0  .
  • Upper confidence limit requests an upper confidence limit for the test of the one-sided null hypothesis, h sub 0 , colon  rho   greater than or equal to , rho sub 0  .
By default, the level of the confidence limits for the correlation is 95%.
Nonparametric Correlations
Spearman’s rank-order correlation
calculates Spearman rank-order correlation. This is a nonparametric measure of association that is based on the rank of the data values. The correlations range from –1 to 1.
Kendall’s tau-b
calculates Kendall tau-b. This is a nonparametric measure of association that is based on the number of concordances and discordances in paired observations. Concordance occurs when paired observations vary together, and discordance occurs when paired observations vary differently. Kendall's tau-b ranges from –1 to 1.
Hoeffding’s measure of dependence
calculates Hoeffding's measure of dependence, D. This is a nonparametric measure of association that detects more general departures from independence. This D statistic is 30 times larger than the usual definition and scales the range between –0.5 and 1 so that only large positive values indicate dependence.
Plots
You can include either of these plots in your results:
  • a scatter plot matrix for variables. You can also choose to include a histogram of the analysis variables in the symmetric matrix plot.
  • a scatter plot for each applicable pair of distinct variables from the analysis variables. You can specify whether to display the prediction ellipses for new observations or the confidence ellipses for the mean.
You can also specify the number of variables to plot and the maximum number of points to plot.
Output Data Set
You can specify whether to create an output data set that contains the Pearson correlation statistics. This data set also includes means, standard deviations, and the number of observations. By default, this data set is saved in the Work library.
You can also choose to include these statistics in the output data set:
  • Correlations – By default, the output data set contains the correlation coefficients with the corresponding _TYPE_ variable value of ‘CORR’.
  • Covariances – When you select this option, the output data set contains the covariance matrix with the corresponding _TYPE_ variable value of ‘COV’.
  • Sum of squares and cross-products – If you assign a column to the Partial variables role, the output data set does not contain a sum of squares and cross-products matrix.
  • Corrected sum of squares and cross-products — If you assign a column to the Partial variables role, the output data set contains a partial corrected sum of squares and cross-products matrix.