Two-Sample t Test
About the Two-Sample t Test Task
A two-sample t test
compares the mean of the first sample minus the mean of the second
sample to a given number, the null hypothesis difference.
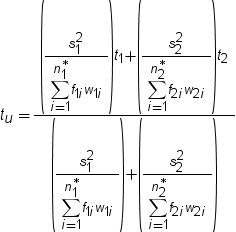
To compare means from
two independent samples with n1 and n2 observations
to a value m, use 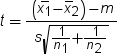 . In this example, s2 is
the pooled variance
. In this example, s2 is
the pooled variance 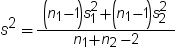 , and s21 and s22 are
the sample variances of the two groups. The use of this t statistic
depends on the assumption that
, and s21 and s22 are
the sample variances of the two groups. The use of this t statistic
depends on the assumption that  , where
  and
and  are the population variances of the two groups.
. In this example, s2 is
the pooled variance , and s21 and s22 are
the sample variances of the two groups. The use of this t statistic
depends on the assumption that , where and are the population variances of the two groups.
To run a two-sample t test,
open the t Tests task. From the t test drop-down
list, select Two-sample test.
Example: Two-Sample t Test
In this example, you
want to analyze the height values for males and females in your class.
To create this example:
-
TipIf the data set is not available from the drop-down list, click
 . In the Choose a Table window,
expand the library that contains the data set that you want to use.
Select the data set for the example and click OK.
The selected data set should now appear in the drop-down list.
. In the Choose a Table window,
expand the library that contains the data set that you want to use.
Select the data set for the example and click OK.
The selected data set should now appear in the drop-down list.


Setting Options
|
Option Name
|
Description
|
|---|---|
|
Tests
|
|
|
Tails
|
specifies the number
of sides (or tails) and direction of the statistical tests and test-based
confidence intervals. You can choose from these options:
|
|
Alternative
hypothesis
|
specifies the value
of the null hypothesis.
|
|
Cox and
Cochran probability approximation for unequal variances
|
calculates the Cochran
and Cox approximation. This approximation of the p-value
of the tu is the value
of p such that
 . In this example, t1 and t2 are
the critical values of the t distribution corresponding
to a significance level of p and sample sizes n1 and n2,
respectively. The degrees of freedom is undefined when . In this example, t1 and t2 are
the critical values of the t distribution corresponding
to a significance level of p and sample sizes n1 and n2,
respectively. The degrees of freedom is undefined when  . (Cochran and Cox 1950). . (Cochran and Cox 1950).
|
|
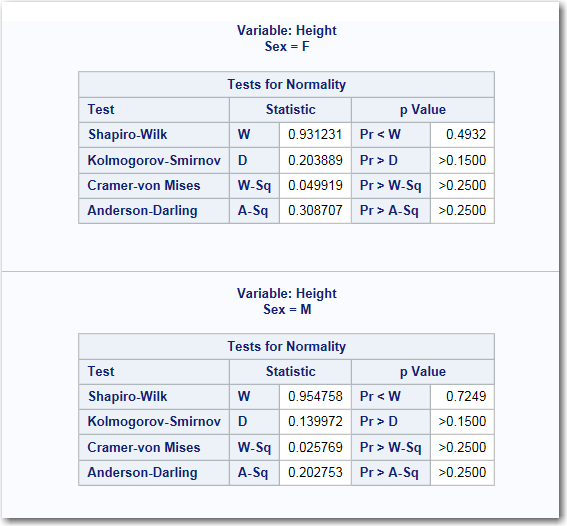
Normality Assumption
|
|
|
Tests for
normality
|
runs tests for normality
that include a series of goodness-of-fit tests based on the empirical
distribution function. The table provides test statistics and p-values
for the Shapiro-Wilk test (provided the sample size is less than or
equal to 2000), the Kolmogorov-Smirnov test, the Anderson-Darling
test, and the Cramér-von Mises test.
|
|
Nonparametric Tests
Note: This option is available
only for a two-tailed test when the alternative hypothesis equals
0.
|
|
|
Wilcoxon
rank-sum test
|
generates an analysis
of Wilcoxon scores. When there are two classification levels (samples),
this option produces the Wilcoxon rank-sum test.
|
|
Plots
|
|
|
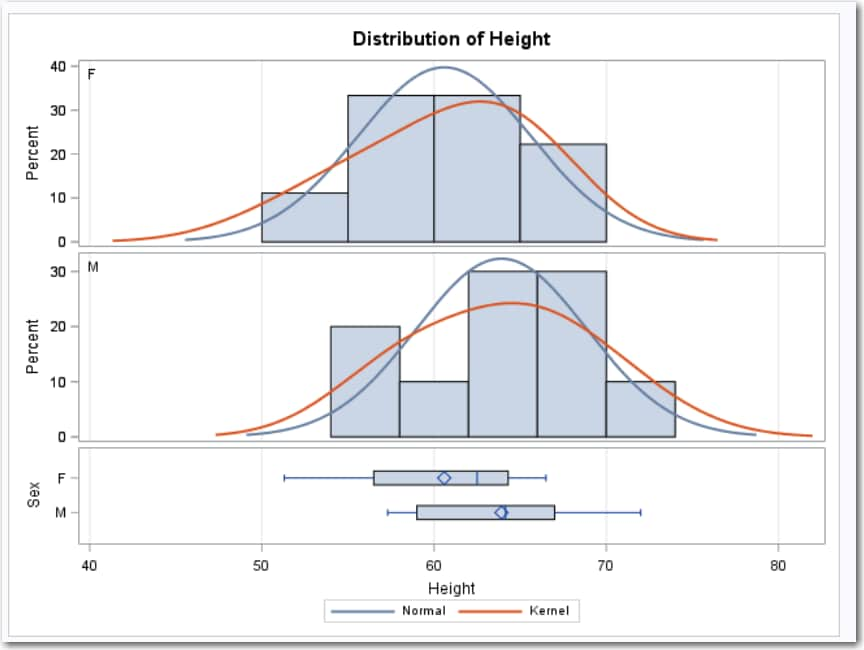
Histogram
and box plot
|
creates a histogram
and box plot together in a single panel, sharing common X axes.
|
|
Normality
plot
|
creates a normal quantile-quantile
(Q-Q) plot.
|
|
Confidence
interval plot
|
creates plots of the
confidence interval for means. This plot is not created by default.
|
|
Wilcoxon
box plot
|
creates a box plot of
Wilcoxon scores. This plot is associated with the Wilcoxon analysis.
This plot is not created by default.
Note: This plot is available only
for a two-tailed test when the alternative hypothesis equals 0.
|
Copyright © SAS Institute Inc. All rights reserved.