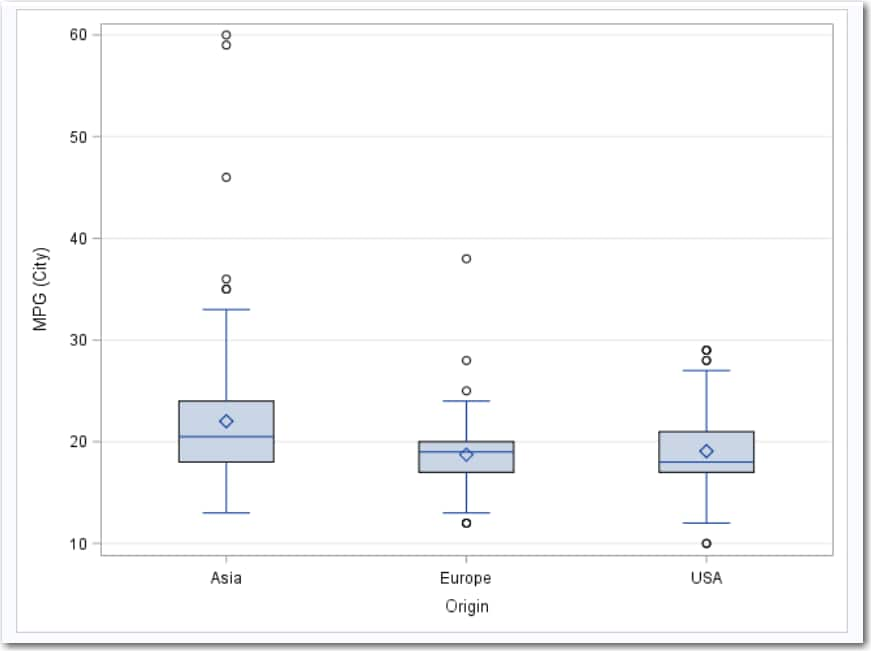
Example: Box Plots Comparing MPG (City) for Cars
This example creates
three box plots that compares how many miles per gallon (city) cars
consume depending on their area of origin (Asia, Europe, and United
States).
To create this example:
-
TipIf the data set is not available from the drop-down list, click
 . In the Choose a Table window,
expand the library that contains the data set that you want to use.
Select the data set for the example and click OK.
The selected data set should now appear in the drop-down list.
. In the Choose a Table window,
expand the library that contains the data set that you want to use.
Select the data set for the example and click OK.
The selected data set should now appear in the drop-down list.

Copyright © SAS Institute Inc. All rights reserved.