Example: Causes of Failure
During the manufacture
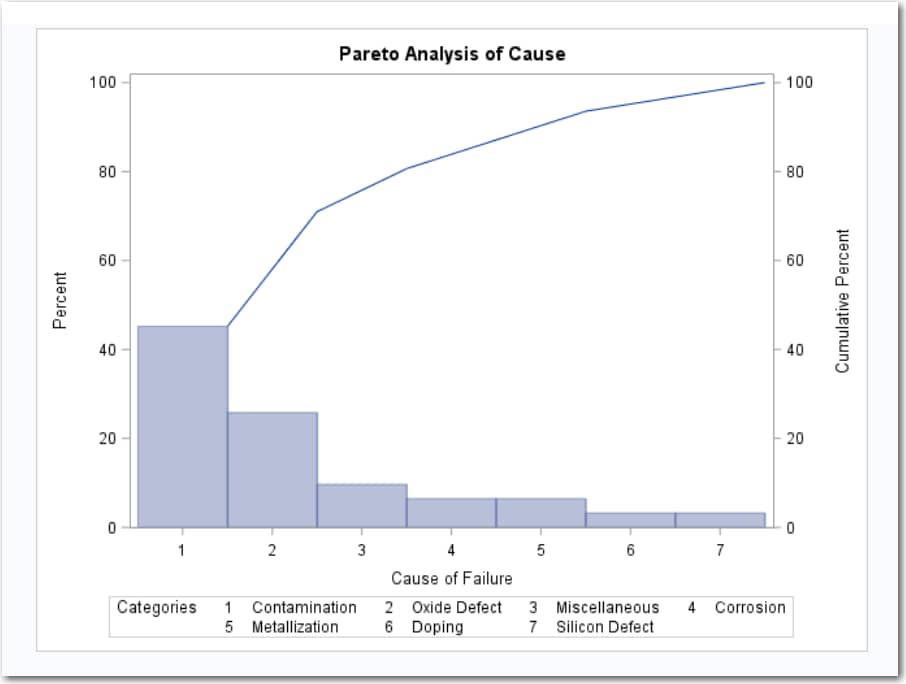
of an MOS capacitor, different cleaning processes were used by two
manufacturing systems operating in parallel. Process A used a standard
cleaning solution, and Process B used a different cleaning mixture
that contained less particulate matter. The failure causes that were
observed with each process for five consecutive days were recorded.
Now you want to compare the causes of the failure for each process.
To create this example:
-
Copy and paste this code onto the Program tab.
data failure;
   length Cause $ 16;
   label Cause='Cause of Failure';
   input Cause & $;
   datalines;
Corrosion
Oxide Defect
Contamination
Oxide Defect
Oxide Defect
Miscellaneous
Oxide Defect
Contamination
Metallization
Oxide Defect
Contamination
Contamination
Oxide Defect
Contamination
Contamination
Contamination
Corrosion
Silicon Defect
Miscellaneous
Contamination
Contamination
Contamination
Miscellaneous
Contamination
Contamination
Doping
Oxide Defect
Oxide Defect
Metallization
Contamination
Contamination
run;
Click to create the Work.Failure data set.
-
TipIf the data set is not available from the drop-down list, click
 . In the Choose a Table window,
expand the library that contains the data set that you want to use.
Select the data set for the example and click OK.
The selected data set should now appear in the drop-down list.
. In the Choose a Table window,
expand the library that contains the data set that you want to use.
Select the data set for the example and click OK.
The selected data set should now appear in the drop-down list.
Copyright © SAS Institute Inc. All rights reserved.