Example: Describing Missing Data for SASHELP.BASEBALL
-
TipIf the data set is not available from the drop-down list, click
 . In the Choose a Table window,
expand the library that contains the data set that you want to use.
Select the data set for the example and click OK.
The selected data set should now appear in the drop-down list.
. In the Choose a Table window,
expand the library that contains the data set that you want to use.
Select the data set for the example and click OK.
The selected data set should now appear in the drop-down list.

Here is how to interpret
the results.
-
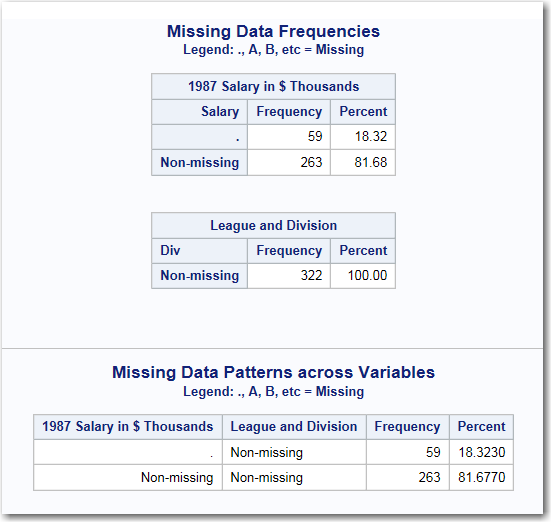
Under the Missing Data Frequencies heading, the first table shows 59 observations in the input data set have a missing value for the Salary variable. The second table shows that there are no missing values for the League and Division variable.
-
Under the Missing Data Patterns across Variables heading, the table shows the pattern of missing values across the variables. In this case, 59 observations have a missing value for the Salary variable. The League and Division variable contains no missing values. Therefore, the remaining 263 observations in the input data set do not have any missing values for the two variables.The legend for this table identifies special missing values in the input data. SAS enables you to differentiate among classes of missing values in numeric data. For numeric variables, you can designate up to 27 special missing values by using the letters A through Z, in either uppercase or lowercase, and the underscore character (_).For more information about special missing values, see SAS Language Reference: Concepts.
Copyright © SAS Institute Inc. All rights reserved.