Example: Determine the Deviation of Label Positions
A manufacturing engineer
carries out a study to determine the source of excessive variation
in the positioning of labels on shampoo bottles (Hansen 1990). A labeling
machine removes bottles from the line, attaches the labels, and returns
the bottles to the line. There are six positions on the machine, and
the engineer suspects that one or more of the position heads might
be faulty.
A sample of 60 bottles,
10 per position, is run through the machine. For each bottle, the
deviation of the label is measured in millimeters, and the machine
position is recorded. In this example, you create a SAS data set named
LabelDeviations, which contains the deviation measurements for the
60 bottles.
-
Copy and paste this code into the Program tab.
data labeldeviations;
   input position @;

   do i=1 to 5;
      input deviation @;
      output;
   end;
   drop i;
   datalines;
1 -0.02386 -0.02853 -0.03001 -0.00428 -0.03623
1 -0.04222 -0.00144 -0.06466 0.00944 -0.00163
2 -0.02014 -0.02725 0.02268 -0.03323 0.03661
2 0.04378 0.05562 0.00977 0.05641 0.01816
3 -0.00728 0.02849 -0.04404 -0.02214 -0.01394
3 0.04855 0.03566 0.02345 0.01339 -0.00203
4 0.06694 0.10729 0.05974 0.06089 0.07551
4 0.03620 0.05614 0.08985 0.04175 0.05298
5 0.03677 0.00361 0.03736 0.01164 -0.00741
5 0.02495 -0.00803 0.03021 -0.00149 -0.04640
6 0.00493 -0.03839 -0.02037 -0.00487 -0.01202
6 0.00710 -0.03075 0.00167 -0.02845 -0.00697
run;
Click to create the Work.LabelDeviations data set.
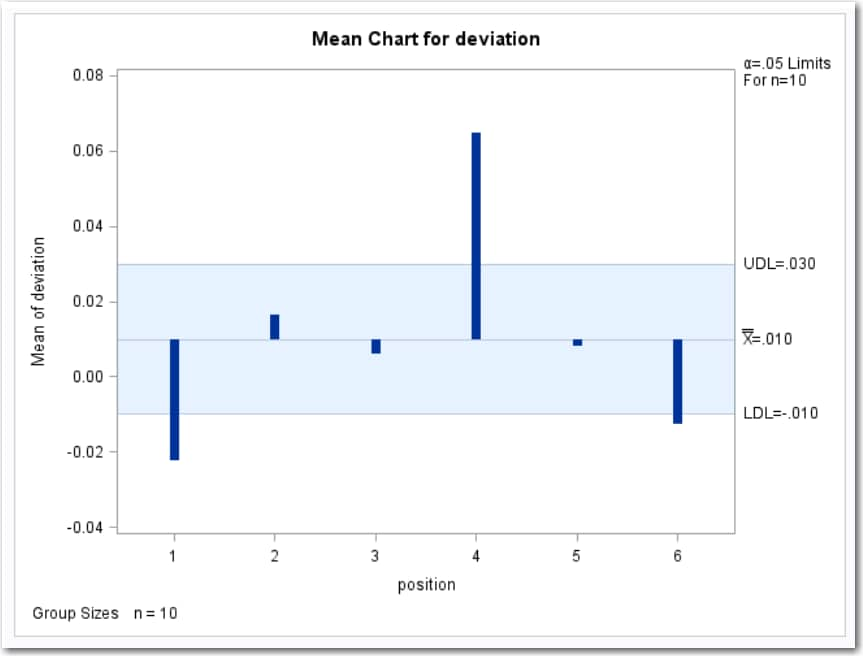
Each point on the chart
represents the average (mean) of the response measurements for a particular
sample. The average for Position 1 is below the lower decision limit
(LDL), and the average for Position 6 is slightly below the lower
decision limit. The average for Position 4 exceeds the upper decision
limit (UDL). The conclusion is that Positions 1, 4, and 6 are operating
differently.
Copyright © SAS Institute Inc. All rights reserved.