The Designer
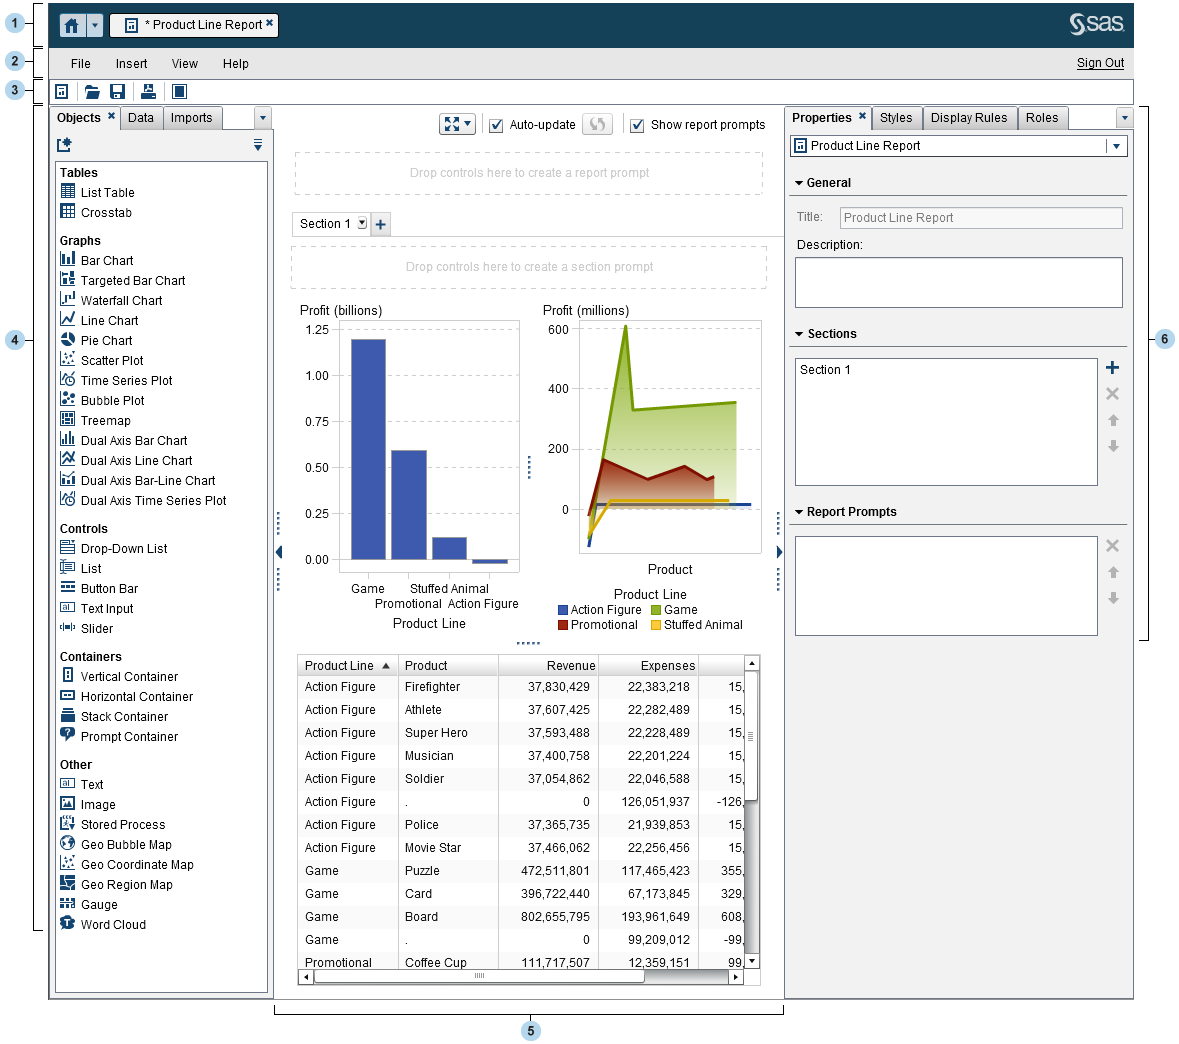
| 1 | The application bar enables you to return to the home page and to access other parts of SAS Visual Analytics and other SAS applications that integrate with the home page. You can also access applications in your recent history. Buttons are displayed for each open application. |
| 2 | The menu bar offers common tasks for the current report or section. |
| 3 | The toolbar enables you to manage and print your reports and expand the workspace. |
| 4 | The tabs in the left pane enable you to work with new report objects, data, imported report objects, and shared rules. |
| 5 | The
canvas is the workspace for building a report. The appearance of the
canvas is affected by the report theme.
A report can have multiple
sections, which can each be accessed by using the tabs at the top
of the canvas. You can change the report view by clicking the icons
at the top of the canvas.
Above the canvas, there
is an Auto-update check box. You can clear
this check box so that you can design your report without waiting
for a query to finish.
There is an area at
the top of the canvas on which you can drag and drop filter controls
and then assign categories to create report-level prompts. If you
do not want to see this area, clear the Show report prompts check
box.
|
| 6 | The tabs in the right pane enable you to work with details about a report and its report objects. |
Copyright © SAS Institute Inc. All Rights Reserved.
Last updated: August 16, 2017