The Designer
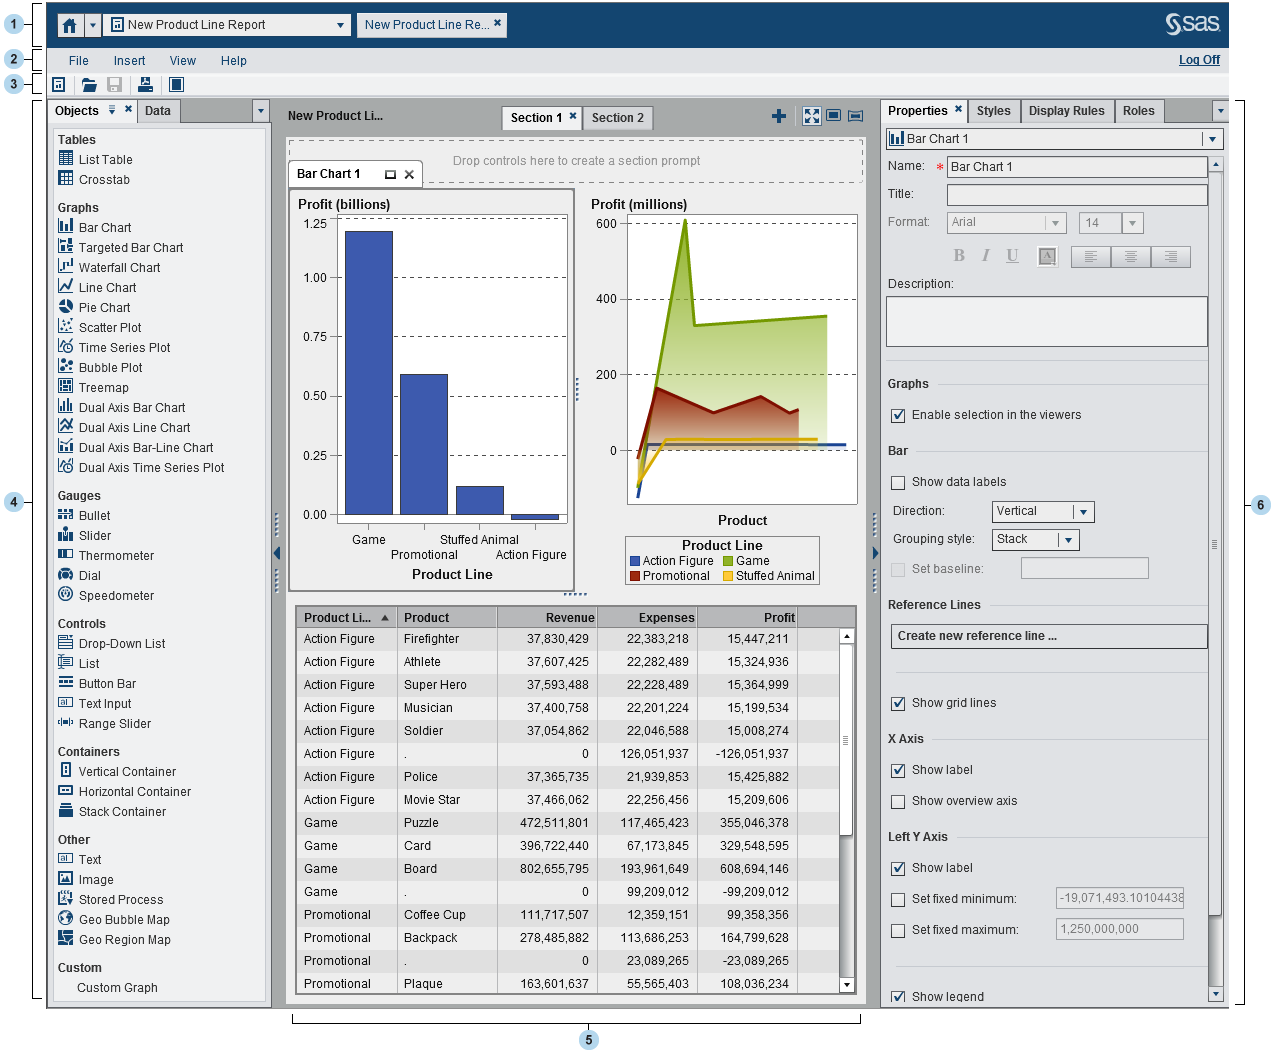
| 1 | The application bar enables you to return to the home page and to access other parts of SAS Visual Analytics and other SAS applications that integrate with the home page. |
| 2 | The menu bar offers common tasks for the current report or section. |
| 3 | The toolbar enables you to manage your reports and expand the workspace. |
| 4 | The tabs in the left pane enable you to work with new report objects, data, imported report objects, and shared display rules. |
| 5 | The
canvas is the workspace for building a report. The appearance of the
canvas is affected by the report theme.
A report can have multiple
sections, which can each be accessed by using the tabs at the top
of the canvas. You can change the report view by clicking the icons
at the top of the canvas.
There is an area at
the top of the canvas where you can drop filter controls and then
assign categories to create section prompts.
|
| 6 | The tabs in the right pane enable you to work with details about a report and its report objects. |
Copyright © SAS Institute Inc. All rights reserved.